Data Analysis
Use Box Plots with Caution!
They Can Be Misleading.

Avi Chawla
They Can Be Misleading.

TODAY'S ISSUE
Box plots are pretty common in data analysis.
Yet, they can be highly misleading at times.
Let’s understand how!
To begin, a box plot is a graphical representation of just five numbers:

This means that if two entirely different distributions have similar five values, they will produce identical box plots, as depicted below:
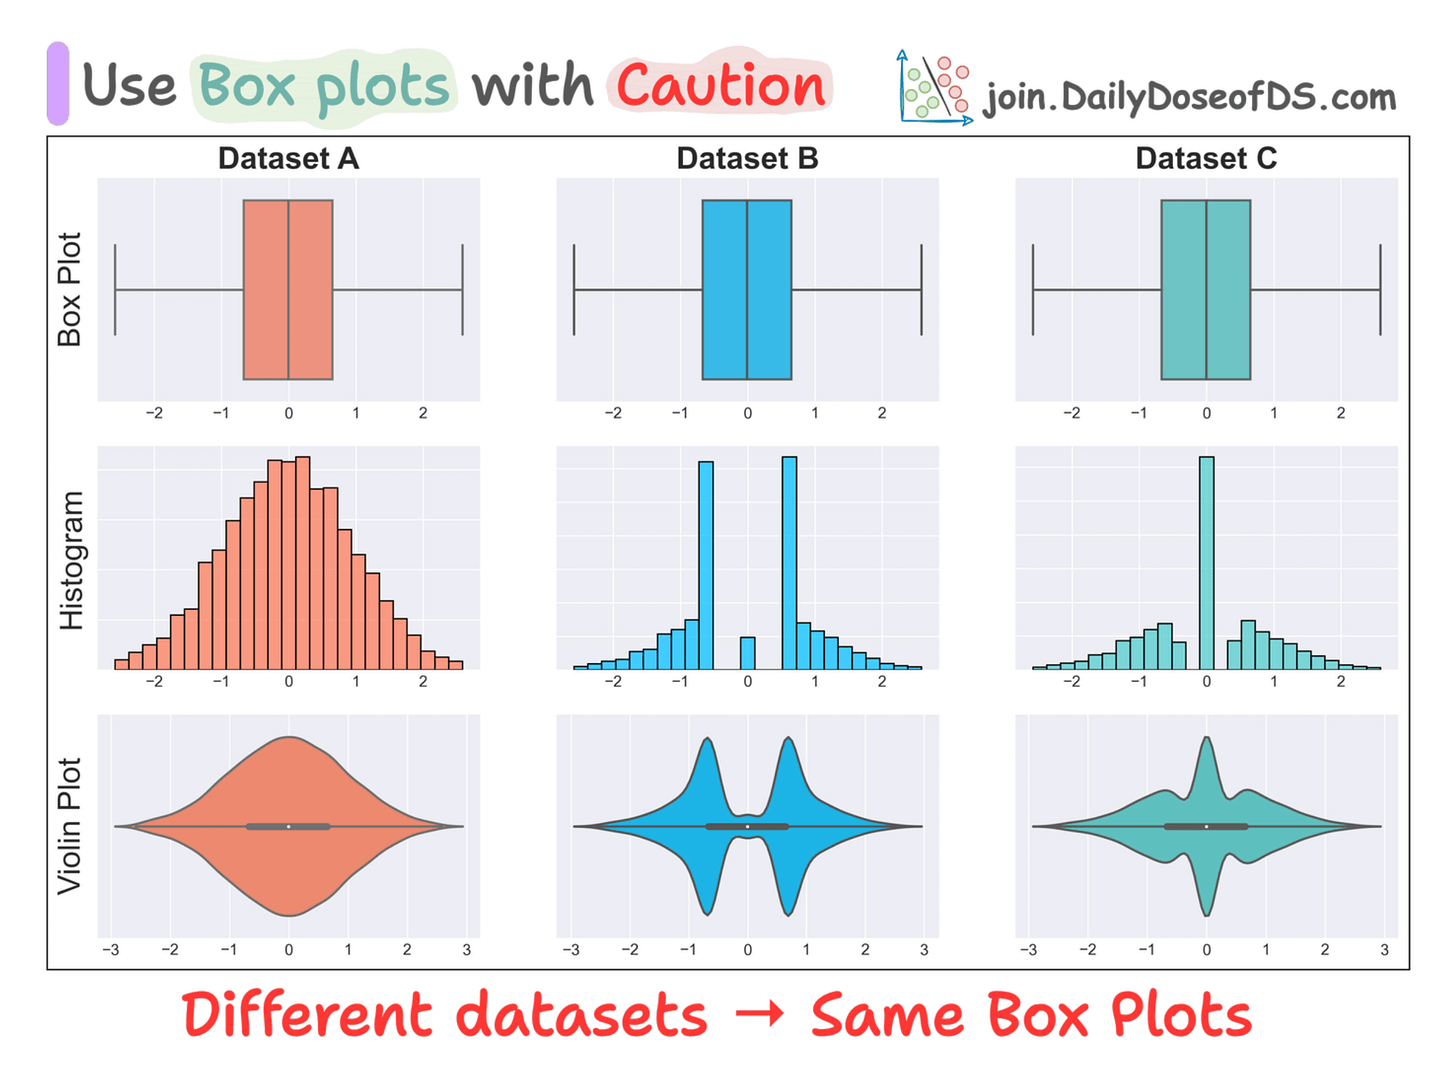
As depicted above, three datasets have the same box plots, but entirely different distributions.
This shows that solely looking at a bar plot may lead to incorrect or misleading conclusions.
Here, the takeaway is not that box plots should not be used.
Instead, the takeaway is that whenever we generate any summary statistic, we lose essential information.
Thus, always look at the underlying data distribution.
For instance, whenever I create a box plot, I create a violin (or KDE) plot too. This lets me validate whether summary statistics resonate with the data distribution.
In fact, I also find Raincloud plots to be pretty useful.
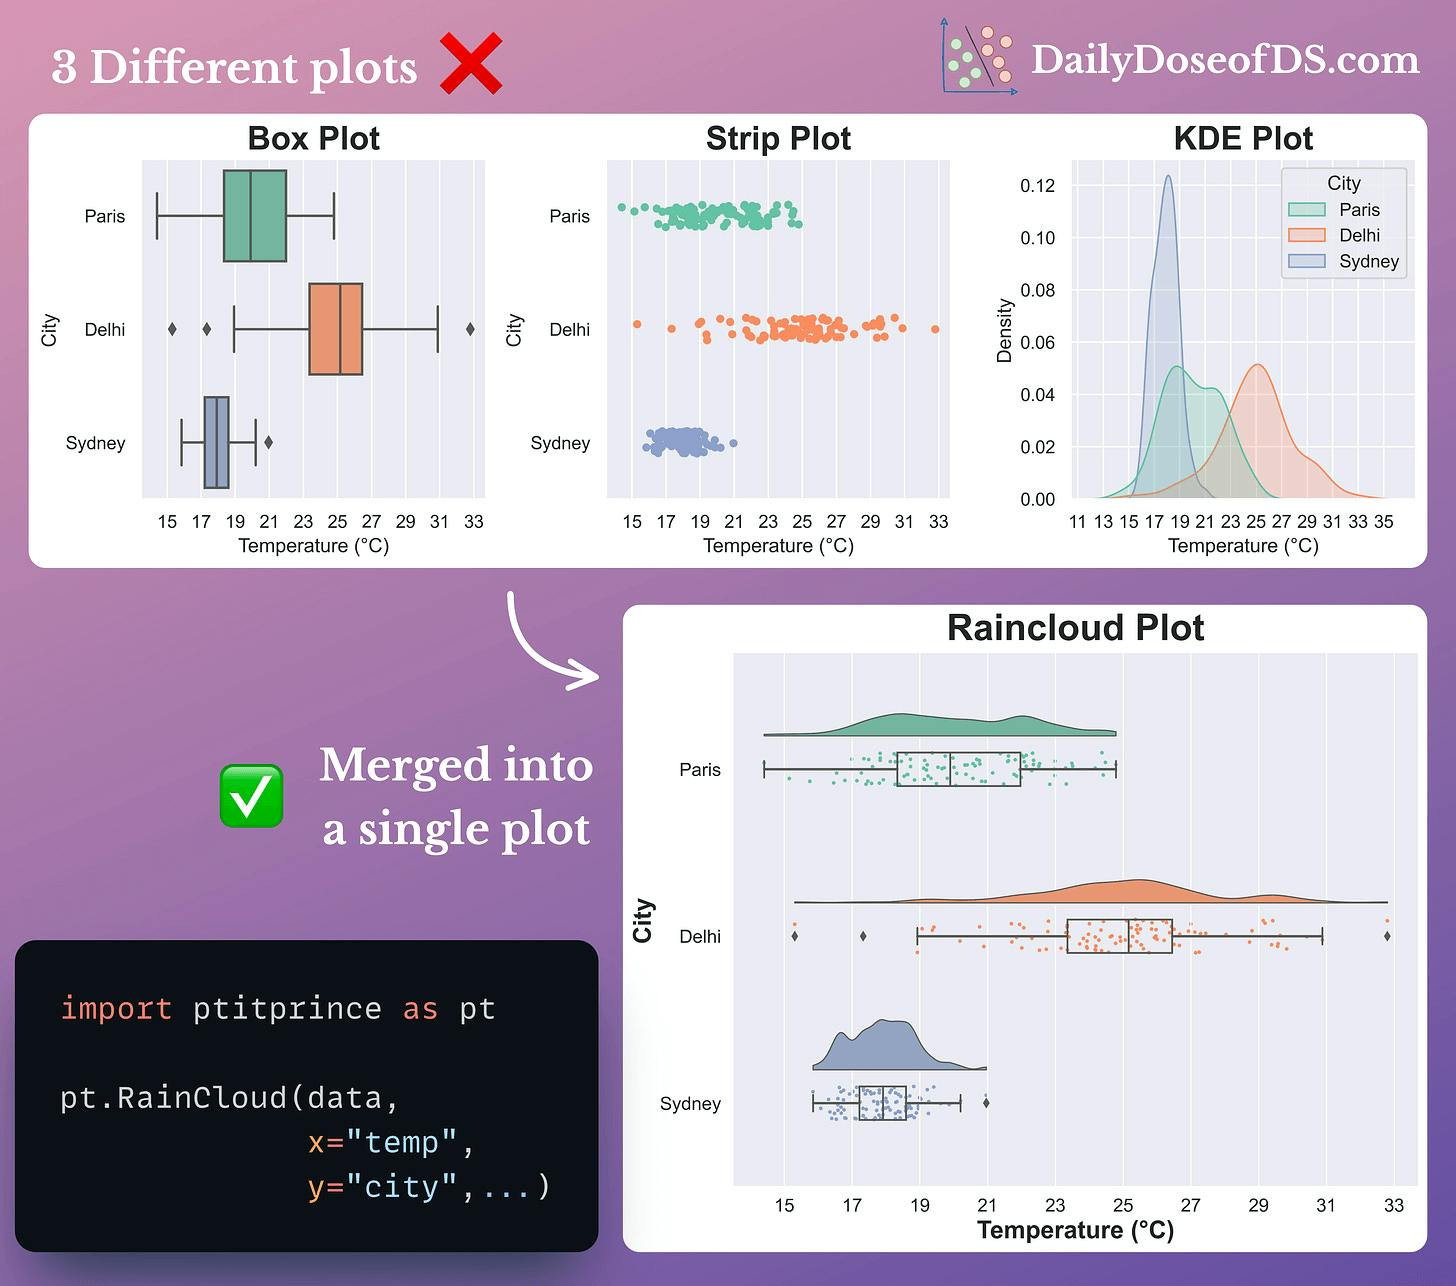
They provide a pretty concise way to combine and visualize three different types of plots together:
Impressive, isn't it?
That said…
Building end-to-end projects has taught me MANY invaluable technical lessons and cautionary measures, which I hardly found anyone talking about explicitly.
I covered 8 more pitfalls and cautionary measures here: 8 Fatal (Yet Non-obvious) Pitfalls and Cautionary Measures in Data Science.
Moreover, I have seen that many ML engineers quickly pivot to building a different model when they don't get satisfying results with one kind of model.
They do not fully exploit the possibilities of existing models and continue to move towards complex ones.
However, after building so many ML models, I have learned various techniques that uncover nuances and optimizations we could apply to significantly enhance model performance without necessarily increasing the model complexity.
I shared 11 such high-utility techniques here: 11 Powerful Techniques To Supercharge Your ML Models.
👉 Over to you: What other measures do you take when using summary statistics?
Once a model has been trained, we move to productionizing and deploying it.
If ideas related to production and deployment intimidate you, here’s a quick roadmap for you to upskill (assuming you know how to train a model):
This roadmap should set you up pretty well, even if you have NEVER deployed a single model before since everything is practical and implementation-driven.