Building an MCP-powered Financial Analyst
100% local.
In this chapter, we'll build a financial analyst that connects to your Cursor/Claude and answers finance-related queries.
The video below depicts a quick demo of what we're building!
Tech stack:
- CrewAI for multi-agent orchestration.
- Ollama to locally serve DeepSeek-R1 LLM.
- Cursor as the MCP host.
System overview:
 |
- The user submits a query.
- The MCP agent kicks off the financial analyst crew.
- The Crew conducts research and creates an executable script.
- The agent runs the script to generate an analysis plot.
You can find the code in this GitHub repo →
Let's build it!
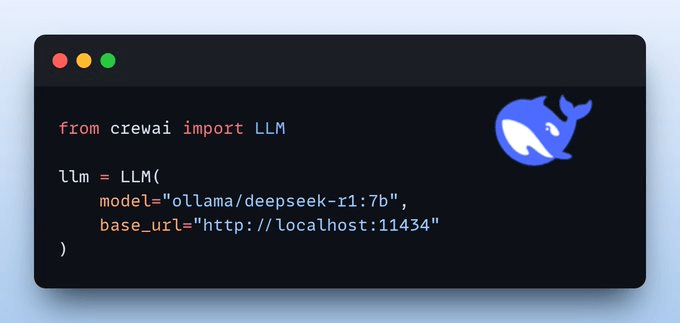
Setup LLM
We will use Deepseek-R1 as the LLM, served locally using Ollama.
 |
Let’s set up the Crew now.
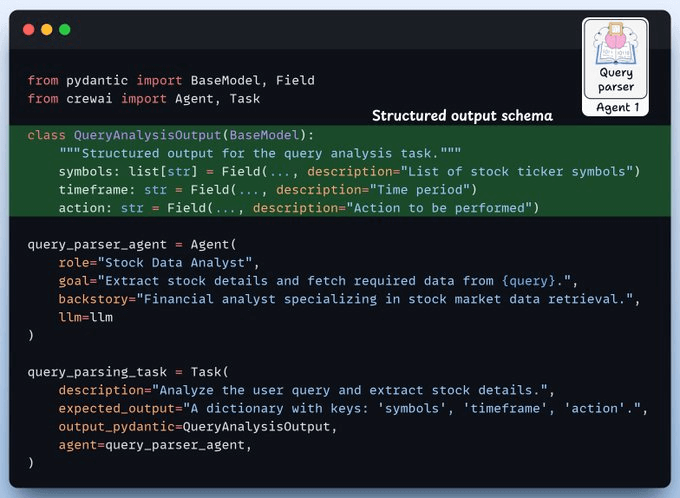
Query parser Agent
This agent accepts a natural language query and extracts structured output using Pydantic.
 |
This guarantees clean and structured inputs for further processing!
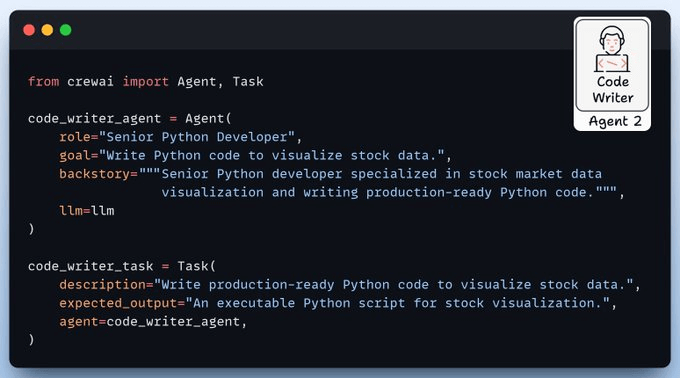
Code Writer Agent
This agent writes Python code to visualize stock data using Pandas, Matplotlib, and Yahoo Finance libraries.
 |
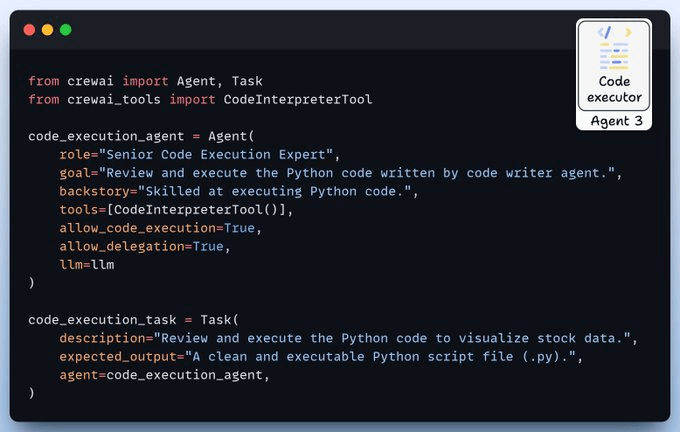
Code Executor Agent
This agent reviews and executes the generated Python code for stock data visualization.
It uses the Code Interpreter tool by CrewAI to execute the code in a secure sandbox environment.
 |
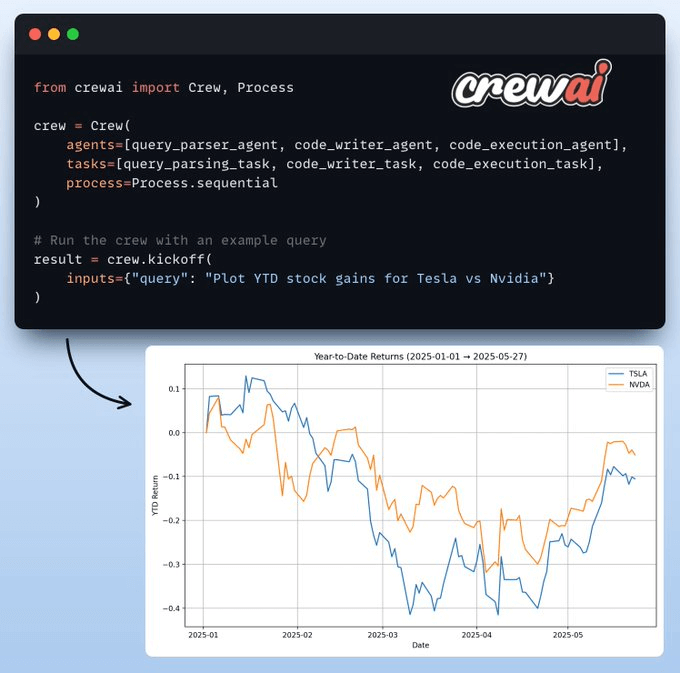
Setup Crew and Kickoff
Once we have our agents and their tasks defined, we set up and kick off our financial analysis crew to get the result shown below!
 |
Create MCP Server
Now, we encapsulate our financial analyst within an MCP tool and add two more tools to enhance the user experience.
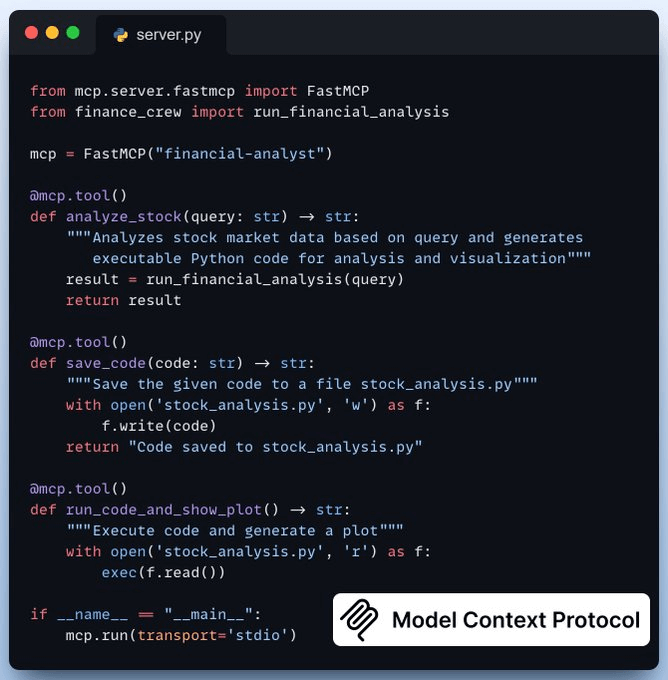 |
save_code-> Saves generated code to local directoryrun_code_and_show_plot-> Executes the code and generates a plot
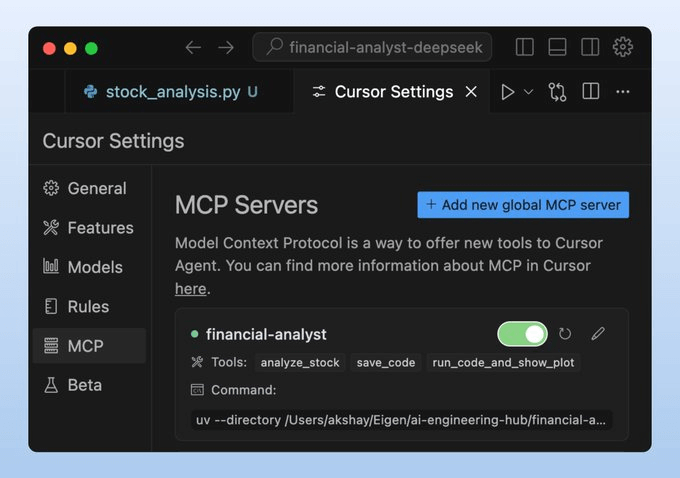
Integrate MCP server with Cursor
Go to: File → Preferences → Cursor Settings → MCP → Add new global MCP server.
In the JSON file, add what’s shown below 👇
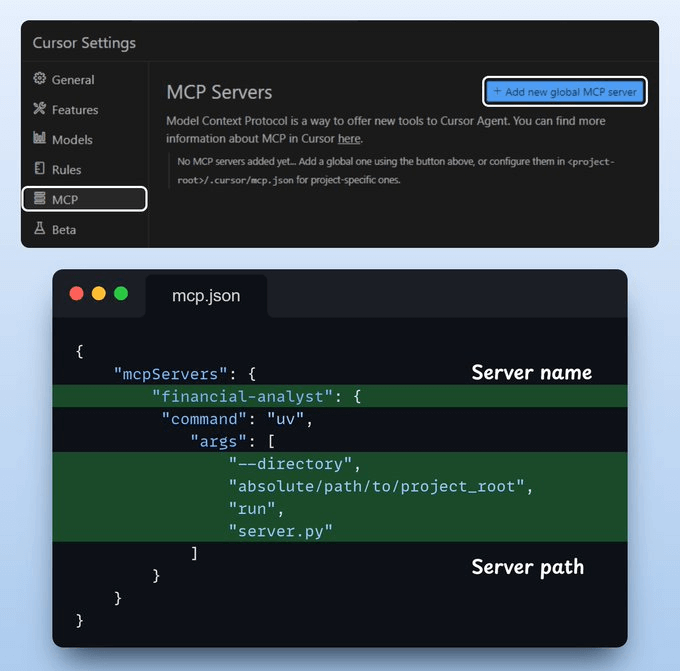 |
Done! Our financial analyst MCP server is live and connected to Cursor!
 |
You can chat with it about stock data, ask it to create plots, etc. The video at the top gives you a walk-through.
You can find the code in this GitHub repo →
Thanks for reading!