Monitoring and Observability: Practical Tooling with Evidently, Prometheus, and Grafana
MLOps Part 17: ML monitoring in practice with Evidently, Prometheus and Grafana, stitched into a FastAPI inference service with drift reports, metrics scraping, and dashboards.
Recap
In Part 16 of this MLOps and LLMOps crash course, we started exploring monitoring and observability for ML systems.

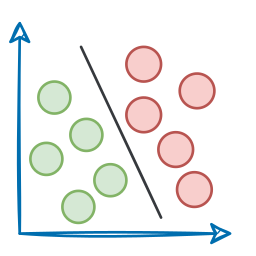
We began by understanding and exploring why even models degrade and the reasons behind the degradation of performance. This included learning about data drift, concept drift, training-serving skew and outliers.
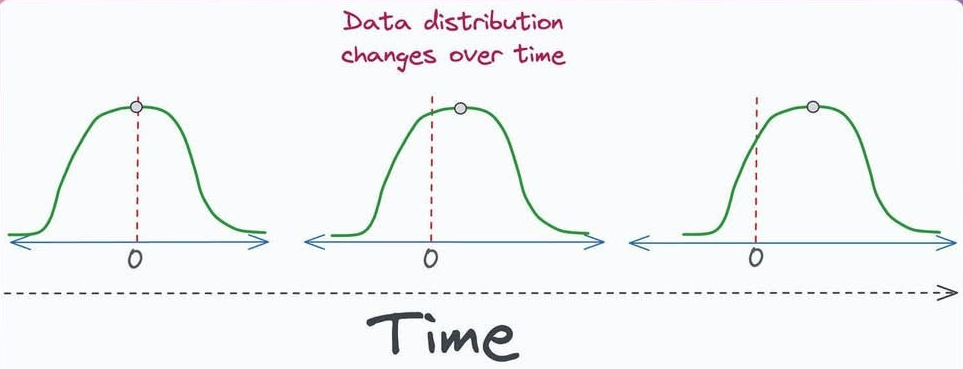
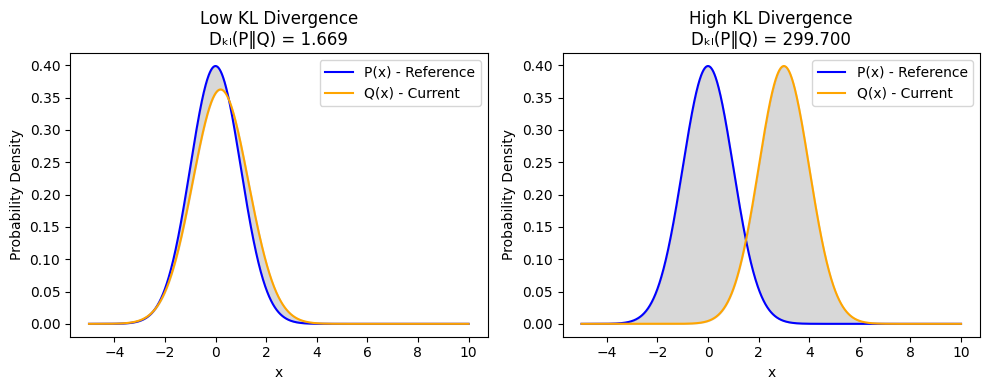
After that, we went ahead and explored techniques for detecting drift like, KL divergence, KS test, ADWIN, etc. We also covered the configuration of alerts and handling of outliers.
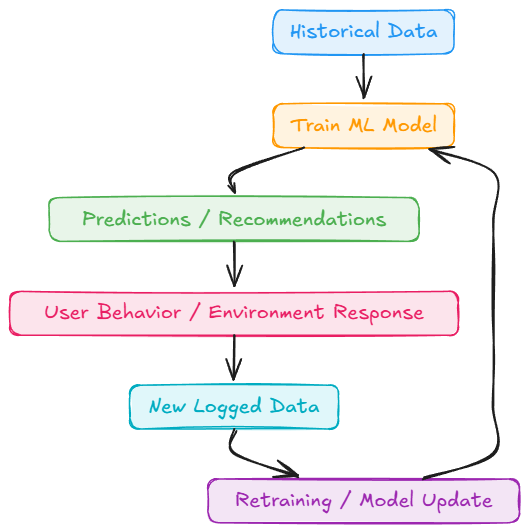
Next, we did a brief discussion on logging and observability for ML systems, understanding output logging, system metrics, resource metrics, cost, observability, and feedback logging.
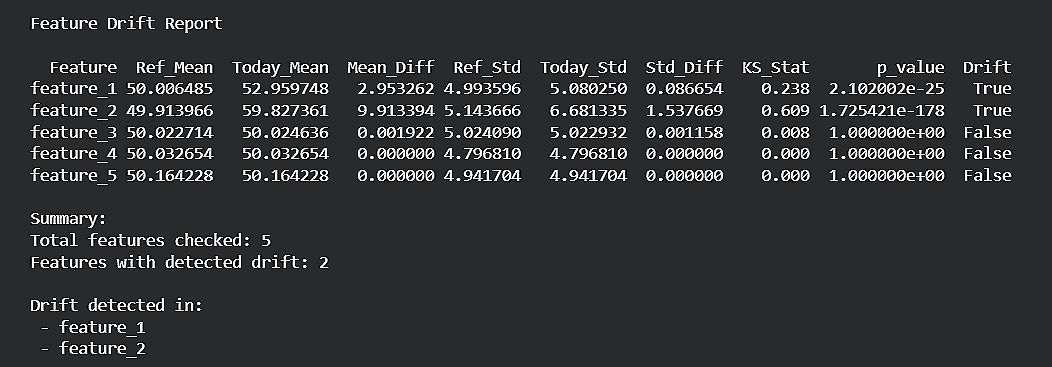
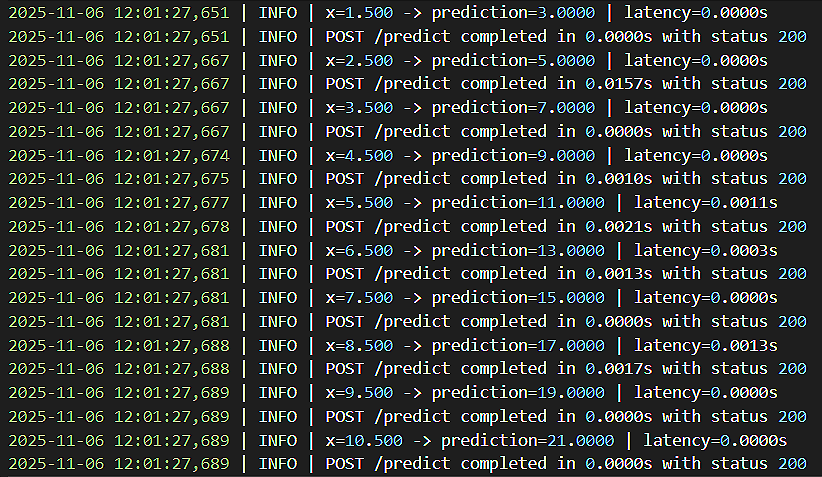
Finally, we went hands-on covering two exercises: one on drift detection with KS test and the other on logging and result collection in FastAPI-based applications.
If you haven’t explored Part 16 yet, we strongly recommend going through it first, since it sets the foundations and flow for what's about to come.
Read it here:
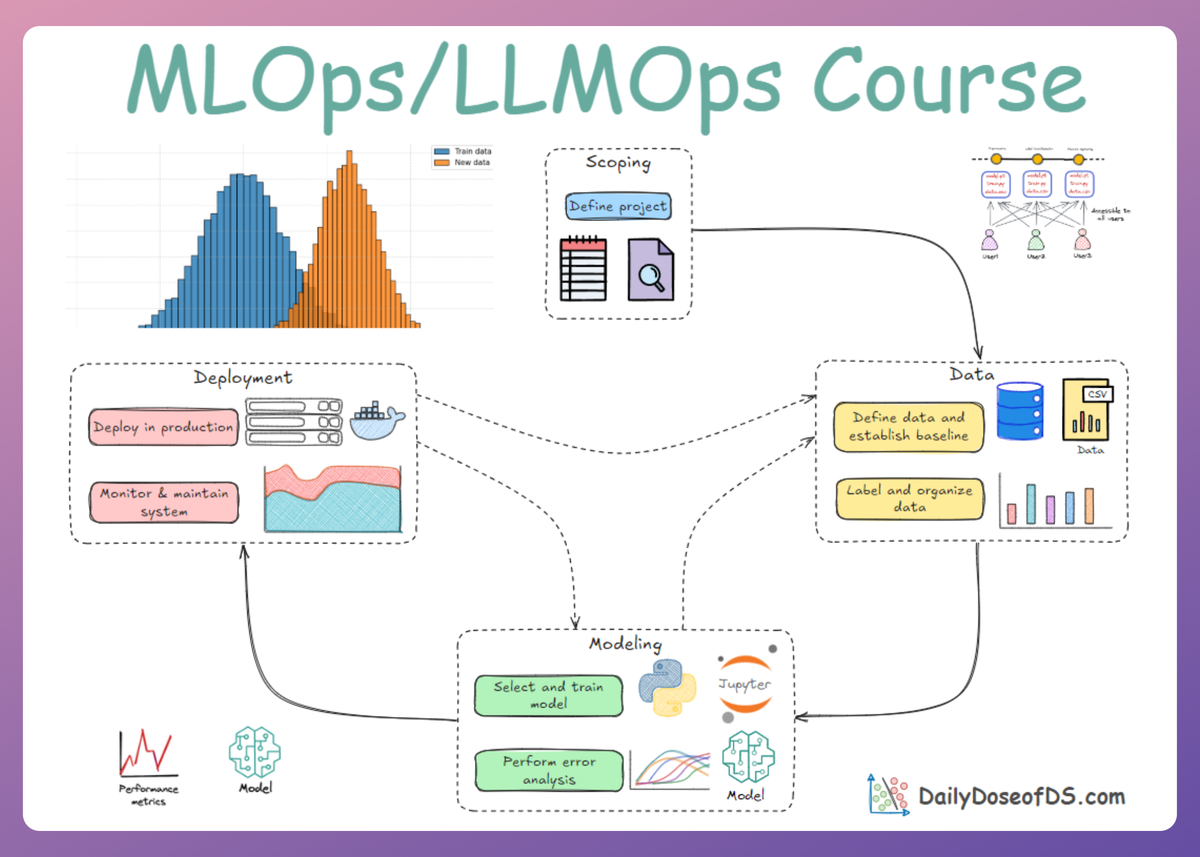
In this chapter, we’ll continue our discussion of the monitoring and observability phase, covering popular tools and frameworks.
As always, every notion will be explained through clear examples and walkthroughs to develop a solid understanding.
Let’s begin!
Introduction
This chapter will introduce some of the most common tools to rely on to ensure ML systems remain healthy, reliable, trustworthy, and aligned with real-world behavior long after deployment.
These tools make the invisible visible. They provide the lens through which we “see inside the black box” when the only thing the outside world sees is a simple prediction.
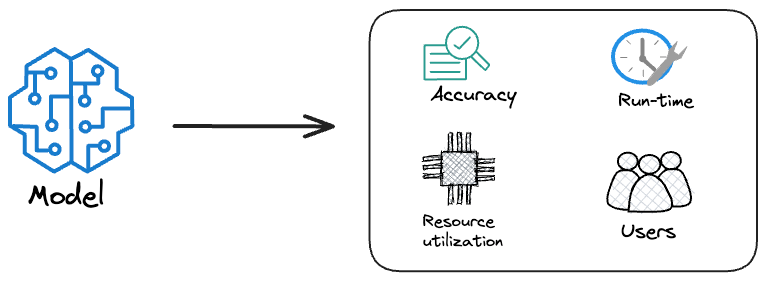
As the ML system unfolds from offline experimentation into a real-time production environment, the role of monitoring becomes essential.
In production, nothing is visible unless you explicitly measure it. You do not see the input data as it flows through your APIs, and you do not notice drift unless you actively compute it.
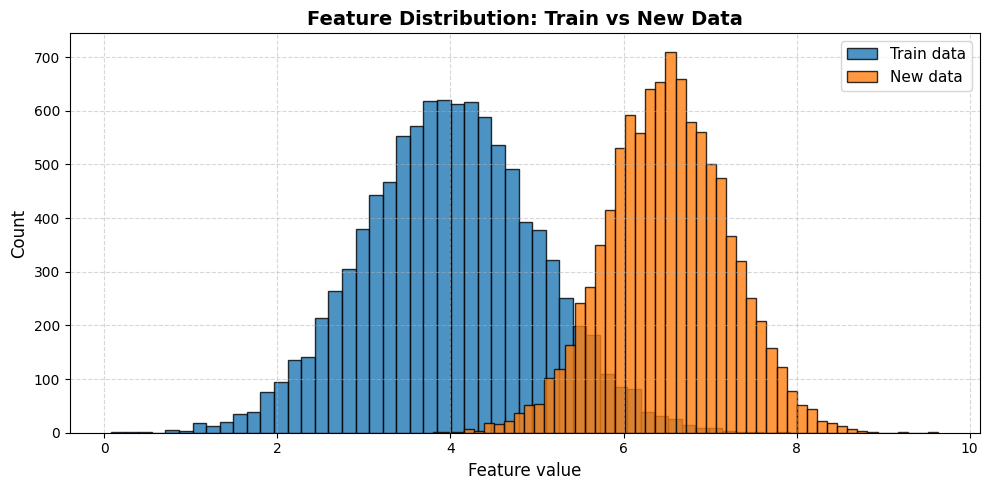
A latency spike remains hidden unless you track it, and failures go unnoticed without proper alerting.
Likewise, model degradation stays invisible until logs and metrics expose the underlying issues.
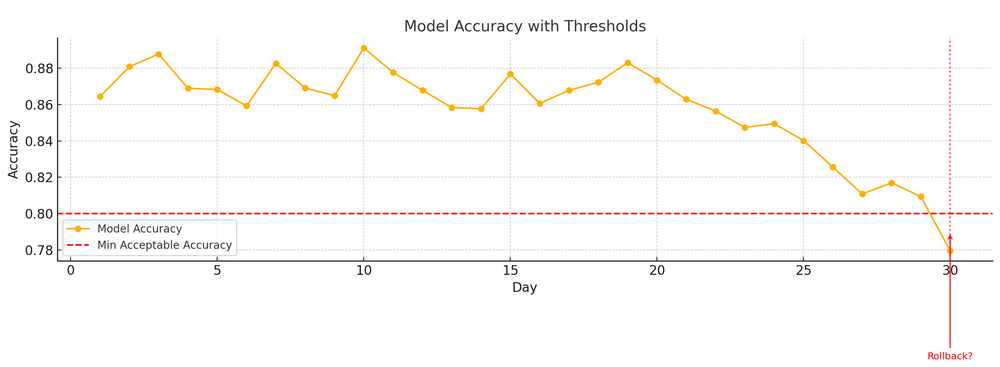
Monitoring is what turns these hidden problems into observable signals you can act upon. Hence, to prevent any disasters, engineering teams, as per their objectives, adopt a suitable and modern observability stack consisting of:
- Functional monitoring tools
- Operational monitoring tools
Let’s go ahead and understand them.
Functional monitoring (ML-specific)
These tools help continuously evaluate and safeguard the quality of a model’s behavior in production.
They monitor data drift to detect shifts between training and live data, and concept drift to identify when the relationship between inputs and outputs changes over time.

They track data quality issues such as missing values, outliers, or schema deviations, while also detecting model performance degradation when ground-truth labels are available.
Additionally, they observe feature distribution changes and prediction distribution anomalies to ensure the model isn’t producing unexpected outputs.
Even in fully unlabeled environments, they support unsupervised confidence monitoring to flag risky or uncertain predictions before they cause real-world failures.
Functional monitoring answers questions like:
- “Is the data in production still similar to training data?”
- “Has the relationship between features and labels changed?”
- “Are we seeing unusual predictions lately?”
In this category, the most widely used open-source tool is Evidently AI.

We'll explore it thoroughly in the later sections.
Operational monitoring (system monitoring)
These tools monitor the overall health of the application running the model.
They track latency to ensure responses remain fast and reliable, and measure throughput in terms of requests per second to understand system load.

They continuously check the error rate to catch failing endpoints early, while monitoring CPU and memory usage to detect resource bottlenecks. For models running on accelerated hardware, GPU utilization is closely observed to ensure efficient usage.
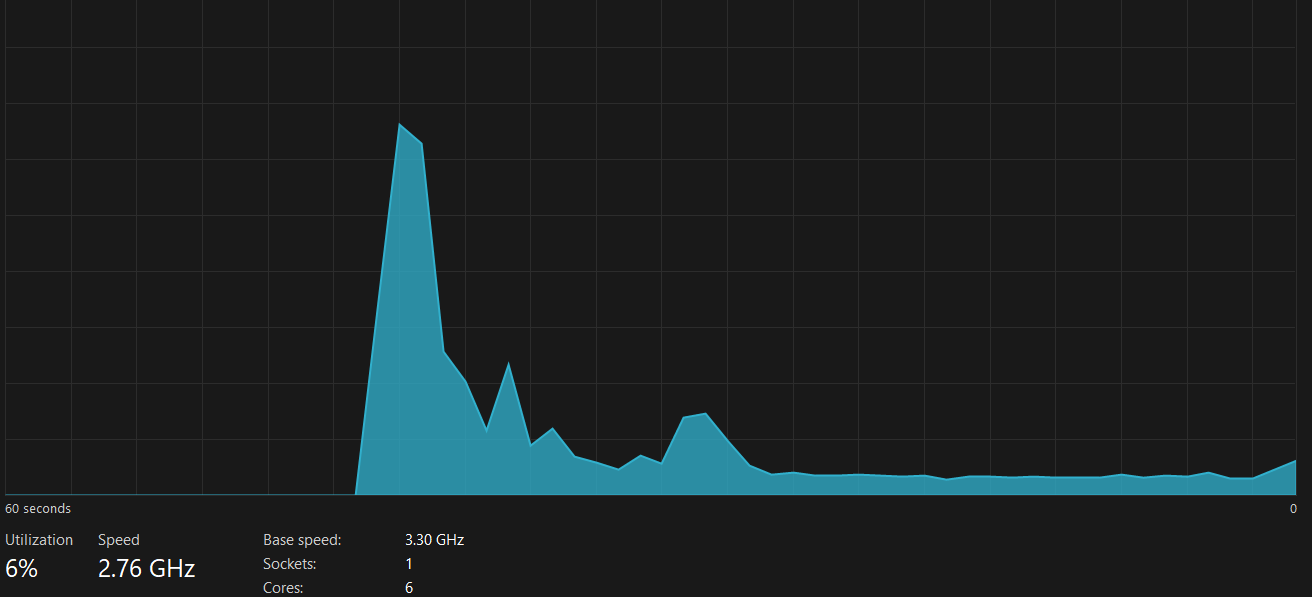
They also watch for container crashes, network errors, and overall service availability, helping maintain a stable, resilient, and highly observable production environment.
This domain is well solved in traditional software engineering. ML inherits this toolkit from DevOps and Site Reliability Engineering (SRE).
The most widely used operational tools in modern ML and software systems are Prometheus for metrics collection and Grafana for visualization and alerting.

Prometheus efficiently scrapes, stores, and queries metrics; Grafana then visualizes these metrics through interactive dashboards. Together, they form the backbone of robust observability pipelines in ML-powered applications.
These tools together ensure:
- “Is my service alive?”
- “Is it overloaded?”
- “Is it crashing?”
A model may be functionally perfect but operationally broken. For example:
- A fraud model may technically produce correct predictions, but because inference latency spikes from 50ms to 2 seconds, users abandon checkout.
- A churn model may be giving correct scores, but your API returns errors due to memory pressure.
Hence, monitoring in ML systems needs both the functional and operational pillars.
Let’s now move ahead and explore each of the above-mentioned tools individually, understanding their roles, capabilities, and how they fit into a monitoring pipeline.
Evidently AI
When we talk about functional monitoring, especially in ML systems, Evidently is one of the most powerful and widely used open-source suites available today.

It focuses on understanding the data, not just the system metrics.
Evidently’s core capabilities include:
Data drift detection
Evidently places data drift detection at the core of its monitoring capabilities by automatically comparing feature distributions over time and highlighting deviations that may affect model performance.
It uses a wide range of statistical tests, such as the Kolmogorov–Smirnov (KS) test, KL Divergence, Chi-square tests for categorical features, etc., to quantify how much current data differs from the training or reference dataset.

Evidently handles these tests seamlessly under the hood, giving teams clear, intuitive reports and dashboards that make drift detection effortless, reliable, and production-ready.
Data quality checks
Evidently also provides comprehensive data quality monitoring to ensure that incoming data is clean, consistent, and model-ready.
These checks automatically flag issues such as missing values, outliers, range violations, and type mismatches that could destabilize model behavior.

Evidently further tracks correlation changes between features and identifies unexpected categories in categorical fields, helping teams catch silent failures or upstream data pipeline issues before they impact predictions.
Model performance monitoring
Given true labels, Evidently can automatically compute key performance metrics such as accuracy, precision, recall, ROC AUC, F1-score, and detailed confusion matrices.
Beyond just reporting these values, Evidently tracks how each metric changes over time, highlighting sudden drops or gradual degradation.
This makes it easy to detect when a model’s predictive power is declining, enabling timely retraining, recalibration, or root-cause analysis.
Automatic HTML dashboards
One of Evidently’s standout strengths is its ability to generate clean, interactive dashboards with almost no additional engineering overhead.
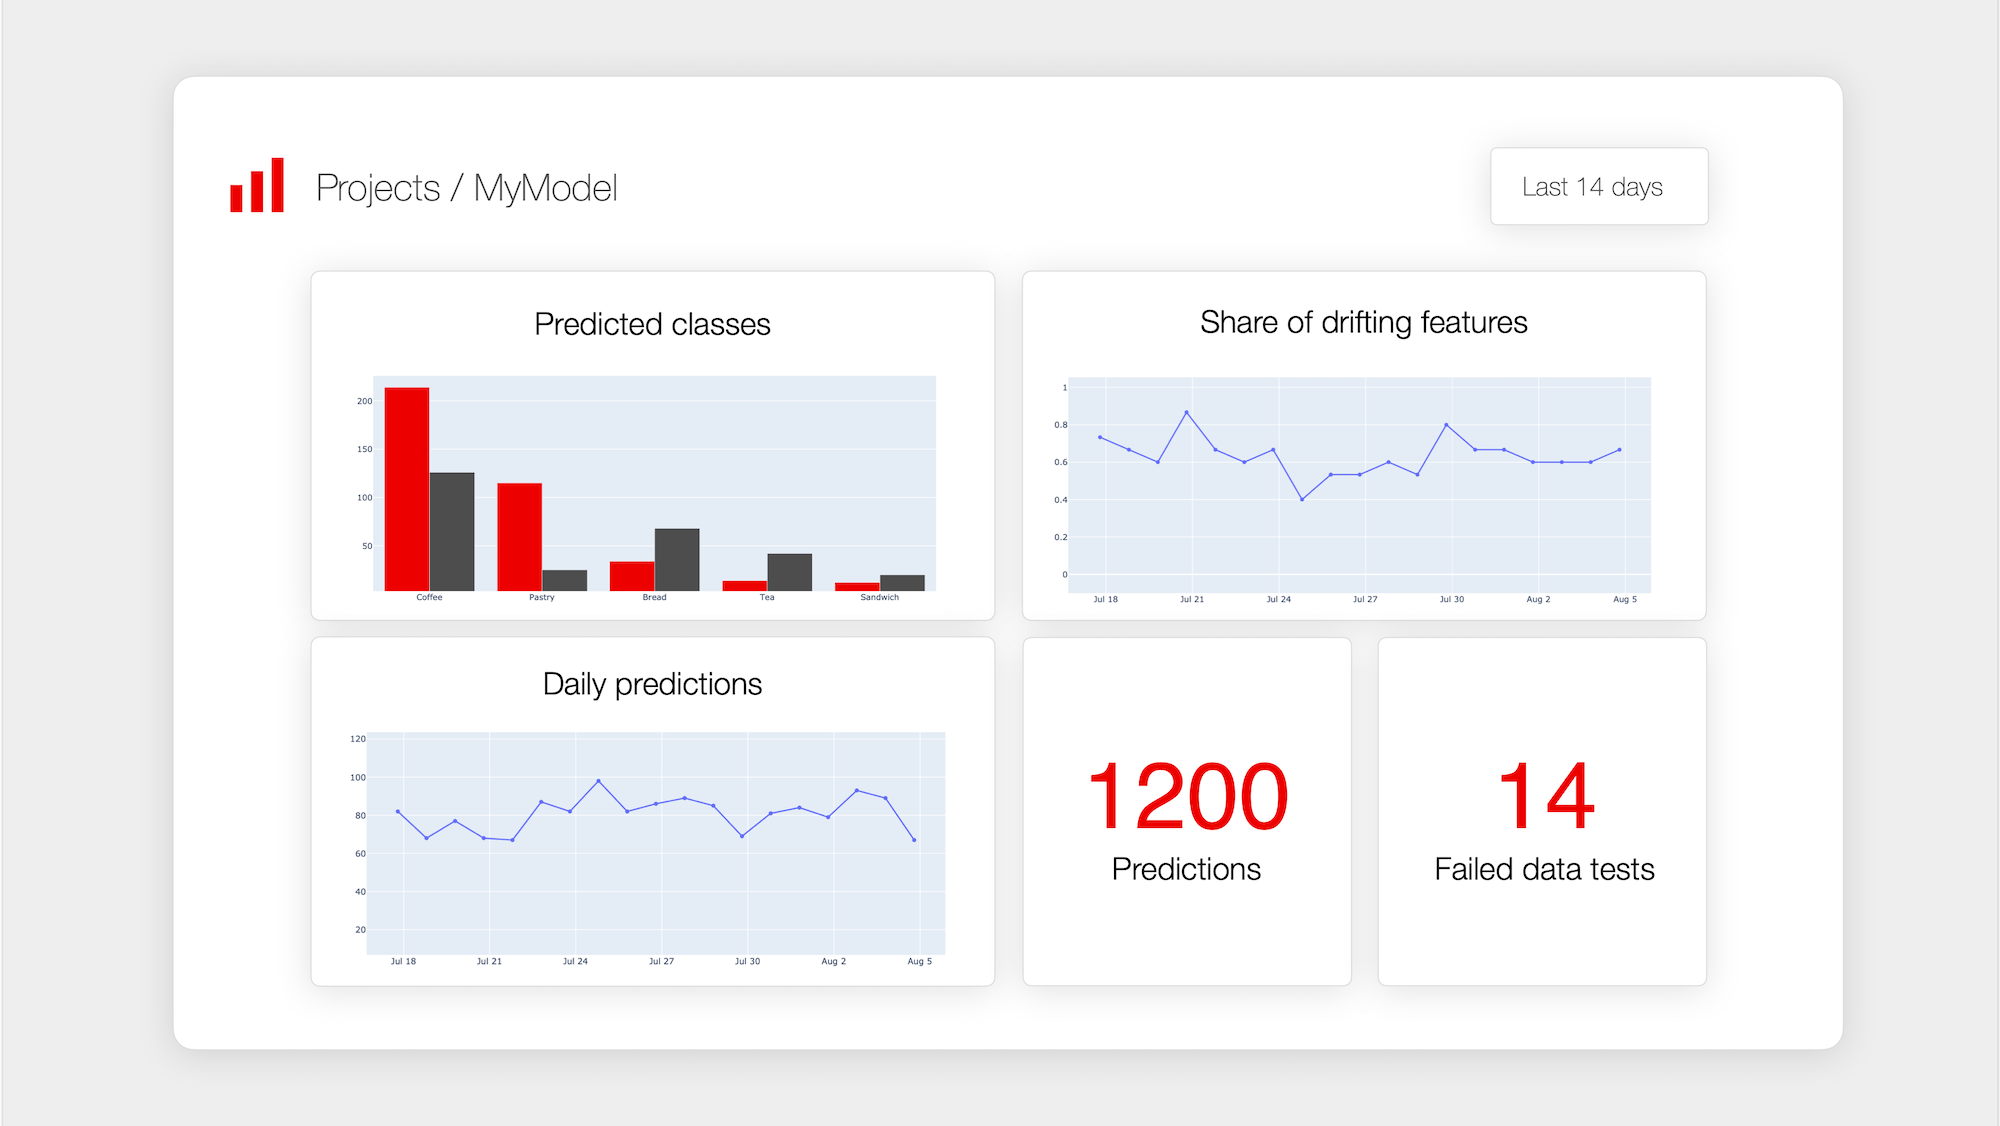
These dashboards can be exported as HTML files, JSON summaries, or even rendered as Jupyter widgets, making them easy to integrate into any workflow.
They can be scheduled to run daily, invoked via Cron Jobs, emailed directly to teams, etc. This automation makes Evidently incredibly practical for continuous monitoring in production environments.
Integrates with pipelines
Evidently is designed to be framework-agnostic, making integration smooth across a wide range of production pipelines.
It works seamlessly with Kubeflow, Prefect, MLflow, FastAPI services, CI/CD pipelines, Kubernetes CronJobs, etc.
Since Evidently is implemented in pure Python, it supports both online monitoring (real-time checks during inference) and offline monitoring (batch reports generated on schedules).
This flexibility allows teams to embed monitoring exactly where it fits best in their MLOps architecture.
Now that we understand Evidently and its capabilities, let’s shift our attention to exploring functional monitoring through some code examples using the open-source Evidently library.
Let's outline the code for functional monitoring with Evidently.
We will simulate drift intentionally to demonstrate how Evidently detects it in practice.
For this, we will generate:
- a reference dataset (representing the training or baseline data), and
- a production dataset (representing today’s live incoming data).
We will then introduce controlled drift in two forms: mean shift and variance shift.
These simple perturbations effectively mimic real-world scenarios such as demographic changes, market fluctuations, seasonal patterns, or upstream data pipeline bugs.
Find the notebook attached below:
