Claude
10 Must-use Slash Commands in Claude Code
...explained with exact prompts and usage!

Avi Chawla
...explained with exact prompts and usage!
Setting up shell aliases is such a natural part of working in a terminal that most developers do it almost reflexively. If you run a command often enough, you alias it.
With Claude Code prompts, though, devs typically skip this step entirely and keep retyping the same 10-15 line instructions from memory, like their code review checklist, test gen constraints, pre-commit scan...and all this session after session.
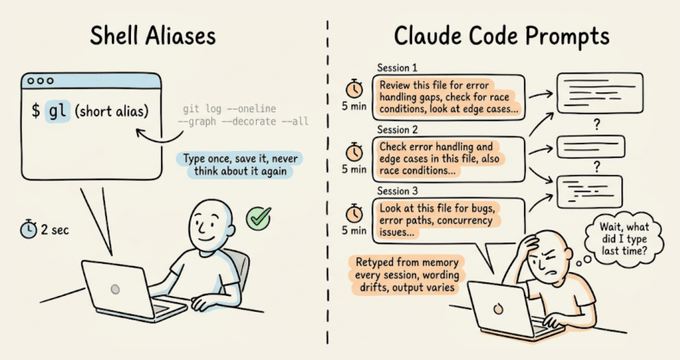
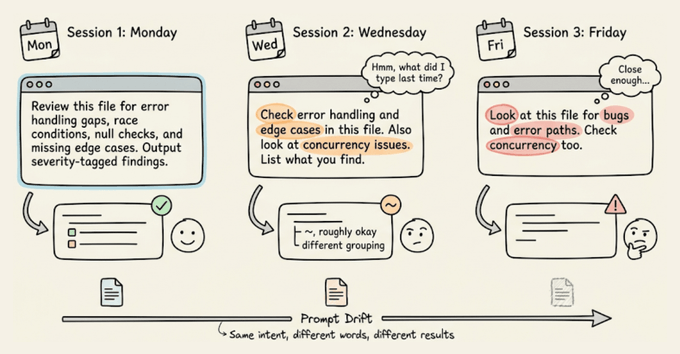
The real cost isn't just the repetition you do as a dev, but the prompt drift.
Every time you retype a prompt from memory, the wording shifts slightly. For instance, you might forget a constraint or phrase the expected output format differently.
With shell commands, this doesn't matter because they're deterministic, but with an LLM, slightly different phrasing may produce noticeably different output.
Claude Code's custom commands fix both problems.
You can save a markdown file in .claude/commands/, and it becomes a slash command you can invoke with identical instructions every time.
The prompts are version-controlled through Git, so your whole team runs the same commands, and when someone improves a prompt, everyone gets the update on their next pull.
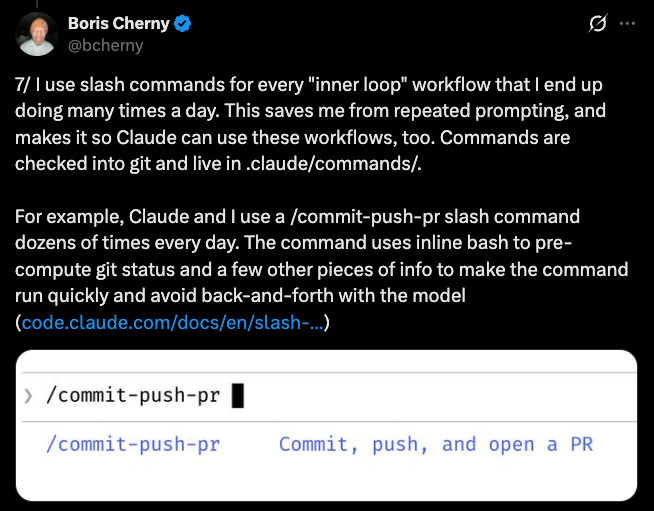
This is the same pattern Boris Cherny described in his thread on Claude Code workflows, where his every repeated workflow becomes a command, checked into Git, and shared with the team:
Let's walk through how to set them up, then the 10 commands that have been most useful in my workflow. I'll demo each one on a real ML inference service (FastAPI, scikit-learn, Alembic) so you can see the actual output, with full prompt templates you can drop into your own project.
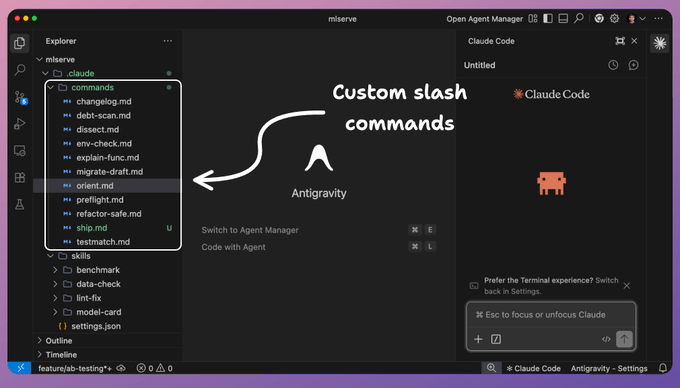
A custom command is a Markdown file inside a .claude/commands/ directory. The filename becomes the command name.
# Project-scoped (shared via Git, shows as "(project)" in autocomplete):
your-repo/.claude/commands/preflight.md  →  /preflight

# User-scoped (personal, works in all projects):
~/.claude/commands/orient.md  →  /orient

# Subdirectories create prefixed commands:
.claude/commands/db/migrate.md  →  /db:migrate
The file content is the prompt that gets sent to Claude when you run the command. You can use $ARGUMENTS as a placeholder for anything typed after the command name.
For instance, running "/dissect src/auth/session.ts" substitutes $ARGUMENTS with "src/auth/session.ts".
You can also inject dynamic context using shell commands with the !`command` syntax:
## Current state
- Branch: !`git branch --show-current`

- Staged changes: !`git diff --cached --stat`

- Last 3 commits: !`git log --oneline -3`
Claude runs those shell commands before processing the prompt, so the context is always fresh.
Lastly, an optional YAML frontmatter at the top of the file lets you pre-approve tools (so Claude doesn't ask for permission on every git call), set a model override, or add a description:
---
description: Pre-commit check for debug artifacts and code smells
allowed-tools: Bash(git *), Bash(grep *), Read, Glob
---
That's the entire system, which includes a markdown file, an optional YAML header, and $ARGUMENTS for dynamic input.
Below, we will share 10 commands we've found most useful in practice.
The first thing you do when you clone a project (or revisit one after a few weeks) is make sure your local setup actually works. It could have a wrong runtime version, missing environment variables, or unapplied migrations.
This command validates the entire local setup in one pass.
---
description: Validate local development environment setup
allowed-tools: Bash(node *), Bash(npm *), Bash(python *), Bash(which *), Bash(cat *), Bash(docker *), Read, Glob
---

Check that this project's development environment is properly configured.

## Step 1: Read project requirements
Look for configuration files that specify requirements:
!`cat .node-version .nvmrc .python-version .tool-versions .env.example 2>/dev/null`
!`cat package.json | head -30 2>/dev/null`
!`cat docker-compose.yml 2>/dev/null | head -10`

## Step 2: Validate each requirement

**Runtime versions:**
- Check installed Node/Python/Ruby version against the project's required version
- Check package manager version (npm/yarn/pnpm/pip/poetry)

**Dependencies:**
- Are node_modules/venv/.venv installed and up to date?
- Are there any peer dependency warnings?

**Environment variables:**
- Compare .env.example (or .env.sample) against the actual .env file
- List any variables present in .example but missing from .env
- Do NOT print actual values of any env vars (security)

**Services:**
- If docker-compose.yml exists, are the required containers running?
- Check if common services (PostgreSQL, Redis, etc.) are accessible on expected ports

**Git hooks:**
- Are git hooks installed (husky, lefthook, pre-commit)?

## Output format
Print a checklist:
✅ Node v20.11.0 (matches .nvmrc)
❌ Missing env var: DATABASE_URL (required by .env.example)
⚠️ node_modules out of date (run npm install)

End with the exact commands needed to fix any ❌ items.
Here's what running /env-check looks like on the ML inference service:
The command caught five categories of issues in one pass, including a Python 3.12 vs 3.11 version mismatch, no virtual environment (it was using system Anaconda), three missing packages (ruff, structlog, pytest-cov), six environment variables defined in .env.example but absent from .env, and an unapplied Alembic migration.
Each finding includes the exact command to fix it, so a developer can go from a broken setup to a working environment by running the commands in sequence.
Once the environment is set up, you need context, like what branch you are on, what you were working on before you stepped away, etc.
This matters especially after running /clear (which you should do regularly to avoid context window degradation). This command reads uncommitted changes, recent commits, and any open TODOs to rebuild your working state in one shot.
---
description: Rebuild working context after /clear
allowed-tools: Bash(git *), Read, Glob
---

Load my current working state into this conversation. Read the following:

1. All uncommitted changes (staged and unstaged):
!`git diff HEAD`

2. The 5 most recent commits with full diffs:
!`git log --oneline -5`

3. Any TODO/FIXME markers in modified files:
!`git diff --name-only HEAD | head -20`

Read each modified file listed above. Identify any TODO, FIXME, or HACK comments in those files.

4. Current branch and its relationship to main:
!`git branch --show-current`
!`git log main..HEAD --oneline 2>/dev/null || echo "No commits ahead of main"`

After loading all of this, give me a brief summary:
- What I appear to be working on (inferred from changes)
- Key files modified
- Any TODOs or incomplete work flagged in the code
- How far ahead of main this branch is
The summary at the end is important because it forces Claude to actually parse everything it loaded, not just dump it into the context window passively.
Here's /orient running after a /clear on the ML inference service:
From a cold start with zero context, the command identified the project (FastAPI ML inference service), the current branch purpose (A/B test routing for model variants), the exact state of the staged work (87 lines in ab_router.py, core logic complete), and three specific issues to resolve before committing: debug artifacts (pdb.set_trace(), breakpoint()), a logging convention violation (print instead of structlog), and missing tests.
The "most important next step" at the end gives you a clear action to start with, instead of re-reading the diff yourself.
Now that you have context and have worked on some updates, the next natural step is checking whether the code you're about to commit is actually clean.
This is the command you can run before every commit. It scans staged changes for things that shouldn't ship, like leftover debug statements, TODO markers, commented-out code blocks, hardcoded secrets, skipped tests, and debug flags.
The key design choice here is that if it finds problems, it lists them and stops. It doesn't fix anything automatically. We don't need an auto-fixer yet that silently changes the code.
---
description: Pre-commit scan for debug artifacts and code smells
allowed-tools: Bash(git *), Bash(grep *), Read, Glob
---

Scan all staged changes for the following issues:

## What to scan
!`git diff --cached`

## Rules
Check for ALL of the following in the staged diff:
1. console.log, console.debug, console.warn statements (unless in a logger utility)
2. TODO, FIXME, HACK, XXX comments
3. Commented-out code blocks (3+ consecutive commented lines)
4. Hardcoded secrets: API keys, tokens, passwords, connection strings
5. .only or .skip in test files (jest, mocha, vitest)
6. Debug flags: debugger statements, #debug, verbose: true in config
7. Large binary files or data dumps added to the commit
8. Import statements for dev-only packages in production code paths

## Output format
If ALL checks pass: respond with "✅ Preflight clear. Staged changes look clean."

If ANY issues found: list every issue with its file path and line context.
Do NOT fix anything. Do NOT unstage anything. Report only.
Here's /preflight catching debug artifacts in the staged A/B router:
It found four blockers in the staged file:
It also flagged two unstaged issues it noticed while scanning: a debug print in predict(.)py and a pytest(.)mark(.)skip masking a flaky test.Lastly, the distinction between "blocker (staged)" and "should-fix (unstaged)" in the summary table is useful because it tells you what will break this commit versus what needs attention separately.
The preflight command discussed above catches the obvious issues.
For a deeper review of a specific file, /dissect provides a structured analysis focused on the things that actually cause production incidents, like error handling gaps, race conditions, missing edge cases, and silent failures
It takes a file path as an argument, so you point it at the module you're most concerned about.
---
description: Deep structural review of a file or module
allowed-tools: Read, Glob, Grep
argument-hint: <file-path-or-directory>
---

Perform a deep structural review of: $ARGUMENTS

## Review dimensions (check all of these)

**Error handling:**
- Are all error paths handled explicitly (no empty catch blocks)?
- Do async operations have proper error propagation?
- Are there any swallowed errors that would fail silently?

**Edge cases:**
- What happens with null/undefined/empty inputs?
- What happens at boundary values (0, -1, MAX_INT, empty arrays)?
- Are there implicit type coercions that could cause subtle bugs?

**Concurrency:**
- Could any state mutation cause race conditions if called concurrently?
- Are shared resources properly synchronized?
- What happens if this function is called twice before the first call completes?

**Dependencies:**
- Are imports used? Flag any unused imports.
- Are there circular dependency risks?
- Is the module tightly coupled to implementation details it shouldn't know about?

**Naming and structure:**
- Do function names accurately describe what they do (including side effects)?
- Are there functions doing more than one thing that should be split?

## Output format
For each finding, give:
- Severity: 🔴 Critical (will cause bugs) / 🟡 Warning (could cause issues) / 🔵 Note (improvement)
- The specific code location
- What could go wrong
- A suggested fix (code, not just description)
Here's /dissect src/routes/predict(.)py reviewing the prediction endpoint:
The review organized findings across six dimensions, but the standout catches were things a standard linter would miss entirely like:
It also cross-referenced the test file and identified that the existing test for the model-not-loaded case actually codifies the wrong behavior by asserting the 200.
Finally, the prioritized "Top 3" at the end gives you a commit-sized action list.
The review above flagged several untested code paths. That's where /testmatch comes in.
One big problem with AI-generated tests is that they never match the existing test style in your project. They might use different assertion libraries, naming conventions, or setup patterns.
This command reads your existing tests first and then generates new ones that look like a human on your team wrote them.
---
description: Generate tests that match existing project test patterns
allowed-tools: Read, Glob, Grep, Bash(npx *), Bash(npm test *)
argument-hint: <file-to-test>
---

Generate tests for: $ARGUMENTS

## Step 1: Learn the existing test patterns
Before writing anything, find and read 2-3 existing test files in this project:
!`find . -name "*.test.*" -o -name "*.spec.*" | head -5`

From those files, identify:
- Test framework (jest, vitest, mocha, pytest, etc.)
- Assertion style (expect/assert/should/chai)
- Naming convention for describe/it blocks
- Setup and teardown patterns (beforeEach, fixtures, factories)
- Mocking approach (jest.mock, sinon, manual mocks, dependency injection)
- File naming convention (*.test.ts, *.spec.ts, __tests__/*)

## Step 2: Read the target file
Read $ARGUMENTS completely. Understand every function, every branch, every error path.

## Step 3: Generate tests
Write tests that:
- Follow EXACTLY the patterns found in Step 1
- Cover every exported function/method
- Include happy path, error cases, and edge cases
- Test boundary values and null/undefined inputs
- Use the same mocking approach as existing tests
- Use the same file naming convention

Place the test file adjacent to the source file following the project's convention.

Do NOT use any test patterns, assertion libraries, or conventions that don't already exist in this project.
Here's /testmatch src/services/prediction_logger(.)py generating tests for the logging service:
It generated 19 tests across three classes (one per public function), all passing on the first run.
The tests matched the existing project conventions exactly same conftest(.)py fixtures, db_session dependency injection, class Test* grouping with flat methods inside.
The most interesting part was a problem it solved proactively. The service functions call db.commit(), which means the normal session.rollback() teardown in conftest(.)py can't undo committed rows between tests.
It added a clean_predictions autouse fixture that deletes all rows before each test to enforce isolation.
That's the kind of subtle interaction between test infrastructure and application code that typically takes a developer a few failed CI runs to discover.
While reviewing and testing the codebase, you'll hit functions where the logic is dense and the reasoning behind the implementation is undocumented.
This command generates inline documentation with a specific rule that it explains the "why," not the "what" since the code already shows what it does.
These comments should capture the reasoning behind non-obvious decisions and the invariants that future maintainers need to preserve.
---
description: Generate why-focused documentation for complex functions
allowed-tools: Read, Grep
argument-hint: <function-name-or-file:line>
---

Document the function or code block at: $ARGUMENTS

## Rules for documentation style
- Explain WHY, not WHAT. The code shows what it does. Comments explain why it does it that way.
- Document non-obvious decisions: "We use a Map instead of an object here because keys can be symbols"
- Document invariants: "This must be called after auth middleware has run"
- Document constraints: "Rate limited to 100 calls/min by the upstream API"
- Document gotchas: "Returns stale data if cache TTL hasn't expired, even after a write"
- DO NOT add comments that restate the code: "// increment counter" above counter++

## Output format
- Add a JSDoc/docstring header with: purpose (one line), parameters with types, return value, throws/errors, and a brief example if the usage isn't obvious
- Add inline comments only where the code makes non-obvious decisions
- Keep every comment under 100 characters per line

Output the function with documentation added. Do not modify the logic.
Here's /explain-func src/preprocessing/pipeline.py documenting the feature engineering functions:
The command documented two functions.
For each one, it explained why specific implementation choices were made: why URLs are stripped before punctuation (reverse order would create garbage tokens), why the IDF formula has a +1 outside the log (prevents zeroing features that appear in every document), why L2 normalization is applied at the end (cosine-distance compatibility with the trained model).
It also flagged the biggest correctness risk in the file: the TF-IDF vocabulary is built from the current batch, not the training corpus, so single-document inference produces meaningless IDF values.
That's the kind of context a new team member may need weeks to discover on their own.
At this point, you've reviewed the code, tested it, and documented it. If /dissect flagged structural problems (like a 45-line handler doing validation, inference, logging, and response formatting in one block), this is the command to fix them.
Refactoring with AI is risky because Claude tends to "improve" things you didn't ask it to touch. This command has an explicit constraint that the public API must not change. It focuses on internal structure only.
---
description: Refactor internals without changing public API
allowed-tools: Read, Grep, Glob
argument-hint: <file-or-function>
---

Refactor the internals of: $ARGUMENTS

## Hard constraints
- DO NOT change any exported function signatures
- DO NOT change any return types or shapes
- DO NOT rename any exported symbols
- DO NOT change the module's public interface in any way
- DO NOT add new dependencies
- Preserve all existing behavior, including edge cases and error messages

## What to improve (internal only)
- Extract repeated logic into private helper functions
- Simplify nested conditionals (early returns, guard clauses)
- Remove dead code paths that can never execute
- Replace magic numbers/strings with named constants
- Improve variable names within function bodies
- Reduce function length by extracting logical steps

## Verification
After refactoring, confirm:
1. Every exported function/type/constant still has the same name and signature
2. All existing tests would still pass without modification (don't run them, just verify compatibility)
3. No new imports were added

Present the refactored code with a brief summary of what changed and why.
Here's /refactor-safe src/routes/predict.py splitting the batch handler:
It extracted seven private helpers from the two route handlers: validation, inference, result building, and DB logging, each got its own function.
The batch handler went from a 45-line monolith to a five-line sequence of helper calls. It also replaced the print(f"DEBUG: ...") with logger.debug(...) to match the project's structlog convention.
One more important part is that it ran the existing 32 tests after refactoring and all passed.
The public API (same endpoints, same request/response schemas, same router export) stayed completely unchanged, which is exactly what the hard constraints in the prompt enforce.
Code is reviewed, tested, documented, and refactored.
The next step is opening a PR, and writing a good PR description is one of those tasks that takes 10 minutes every time but follows the same structure: what changed, why it changed, how to verify it, and what could go wrong.
This command runs the test suite first (same guard-then-execute philosophy as /preflight), then generates a PR description from the actual commits and diff.
---
description: Validate and generate PR description from current branch
allowed-tools: Bash(git *), Bash(gh *), Bash(pytest *), Bash(npm test *), Read, Glob
---

Prepare a pull request for the current branch.

## Step 1: Pre-flight validation
Run the test suite before generating anything. If tests fail, stop and report the failures.
!`git diff --stat main..HEAD`

## Step 2: Assess the diff
!`git log main..HEAD --oneline`
!`git diff --stat main..HEAD`

Check:
- If the diff exceeds 500 lines changed, flag it as a large PR and suggest splitting
- If the branch has more than 15 commits, suggest squashing before opening

## Step 3: Generate PR description
Read the actual code changes (not just filenames) to understand what was built:
!`git diff main..HEAD`

Write a PR description with these sections:

**Summary** (2-3 sentences): What this PR does and why, written for someone who hasn't seen the code.

**Changes** (bullet list): Group related changes together. Reference specific files only when it adds clarity. Skip trivial changes like formatting and import reordering.

**How to test**: Step-by-step instructions a reviewer can follow to verify the changes work. Include specific commands to run, endpoints to hit, or behaviors to observe.

**Risk assessment**: What could go wrong with this change? Does it touch shared infrastructure, modify database schemas, change public APIs, or affect performance-sensitive paths? Be specific. "Low risk" is not useful. "Modifies the prediction endpoint response shape, which could break clients that destructure the old format" is useful.

**Related issues**: Scan commit messages for issue references (#123, JIRA-456) and list them.

## Step 4: Output
Print the PR description in markdown, ready to paste into GitHub.
Do NOT create the PR automatically. Output the description for review first.
Here's /ship generating a PR description for the A/B testing feature:
It ran the full test suite first (50 passed, 1 skipped), then flagged four debug artifacts in ab_router.py as blockers before generating the PR description.
The description itself covered the A/B router, the migration, and the predict route refactor in distinct sections, with concrete curl commands for testing and a risk assessment that caught a non-obvious deployment detail: the router is implemented but not yet wired into any route, so the A/B split won't take effect until it's integrated into the prediction flow.
It also offered to fix the debug artifacts on the spot, which ties directly back to what /preflight caught earlier.
With code reviewed, tested, documented, and refactored, you often need a schema change to support the new feature.
Database migrations need careful handling because they're hard to reverse once shipped.
This command generates a migration file with both up and down methods, plus a safety checklist. It also checks existing migrations to infer the ORM and naming patterns, similar to how /testmatch learns test conventions before generating.
---
description: Draft a database migration with rollback plan
allowed-tools: Read, Glob, Grep
argument-hint: <description-of-schema-change>
---

Generate a database migration for: $ARGUMENTS

## Step 1: Identify the migration system
!`ls migrations/ db/migrate/ prisma/migrations/ drizzle/ alembic/versions/ 2>/dev/null | head -20`

Read 2-3 existing migration files to identify:
- ORM/tool (Prisma, Drizzle, Knex, TypeORM, Alembic, Rails, raw SQL)
- Naming convention (timestamp prefix, sequential numbering)
- Structure (up/down methods, SQL vs ORM DSL)

## Step 2: Generate the migration
Create the migration file following the exact conventions from Step 1.

Requirements:
- Include both UP and DOWN (rollback) logic
- The DOWN must perfectly reverse the UP
- For column additions: set a sensible DEFAULT if the column is NOT NULL
- For column removals in DOWN: document data loss warnings as comments
- For index changes: check that the index name follows the project's naming convention
- For table renames: handle foreign key references

## Step 3: Safety checklist
After the migration code, add a comment block with:
- [ ] Estimated row count for affected tables (check with: SELECT count(*) FROM table)
- [ ] Will this lock the table? (ALTER TABLE on large tables can lock for minutes)
- [ ] Is this backwards-compatible with the current application code?
- [ ] Can this be deployed independently of the application change?
- [ ] What happens if the migration fails halfway through?

Do NOT run the migration. Output the file content only.
Here's /migrate-draft add-ab-test-assignments-table generating a migration for A/B test tracking:
It read the existing migration to match the project's Alembic conventions, then read ab_router(.)py to understand what columns the table actually needs.
The resulting migration included columns derived from the router's logic like the user_id, variant, bucket (the deterministic hash value for auditing assignment fairness), prediction_id as a foreign key back to the predictions table with ON DELETE SET NULL, and assigned_at with a server-side default.
It also added indexes on the three columns you'd filter by when analyzing variant performance. The migration was informed by the application code it would serve.
The last command is the one you run when you want to step back and look at the whole project's health.
Technical debt accumulates invisibly until something breaks.
This command scans for common debt patterns across the entire codebase and outputs a prioritized list you can turn directly into tickets: code complexity, dependency staleness, test coverage gaps, and architectural smells.
---
description: Scan for technical debt patterns and prioritize remediation
allowed-tools: Bash(git *), Bash(npm *), Bash(npx *), Bash(wc *), Bash(find *), Read, Glob, Grep
---

Scan this project for technical debt and produce a prioritized remediation report.

## Scan dimensions

**Code complexity:**
- Find the 5 largest files by line count (often a sign of god objects/modules)
- Identify functions longer than 50 lines
- Flag files with more than 10 imports (high coupling)

**Dependency health:**
!`npm outdated 2>/dev/null || pip list --outdated 2>/dev/null | head -20`
- How many dependencies are more than 2 major versions behind?
- Are there any dependencies with known deprecation notices?

**Test coverage gaps:**
- Find source files that have no corresponding test file
- List them with file size (larger untested files = higher risk)

**Code smells:**
- grep for: any-type assertions (as any, type: any), eslint-disable without explanation, @ts-ignore without comment
- Find duplicated code blocks (same 10+ lines appearing in multiple files)
- Check for TODO/FIXME/HACK comments older than 30 days:
  use `git log` to find when each TODO was introduced

**Architectural smells:**
- Circular dependencies (if a tool like madge is available)
- Business logic in API route handlers (should be in service layer)
- Direct database queries outside of a repository/data-access layer

## Output format
Group findings by priority:
🔴 High: Likely to cause incidents or block feature work
🟡 Medium: Increasing maintenance cost over time
🔵 Low: Code quality improvements

For each finding, include:
- The specific file(s) and what's wrong
- Estimated effort to fix (small/medium/large)
- A one-line description suitable for a ticket title
Here's /debt-scan producing a full project health report:
It found 20 issues across the codebase, each with a severity level, file location, description, and estimated fix time.The high-priority findings included things a linter wouldn't catch, like:
The Recommended Fix Order at the end ranks the top five by impact-to-effort ratio, starting with the two-minute debugger removal and ending with the 45-minute test coverage gap. You could turn each line item into a Jira ticket as-is.
The feature work is done, and the migration is drafted.
Now you need release notes. Changelogs are tedious to write by hand and useless when auto-generated from raw commit messages.
This command sits in between. It reads recent commits, inspects each diff to understand the actual change, and produces a human-readable changelog you can edit before publishing.
---
description: Generate a changelog entry from recent commits
allowed-tools: Bash(git *)
argument-hint: <since-tag-or-commit (optional)>
---

Generate a changelog entry for all commits since: $ARGUMENTS

If no argument provided, use the most recent git tag:
!`git describe --tags --abbrev=0 2>/dev/null || echo "No tags found, using last 20 commits"`

## Gather the raw data
!`git log $(git describe --tags --abbrev=0 2>/dev/null || echo "HEAD~20")..HEAD --pretty=format:"%h %s" --no-merges`

## Rules
- Group changes into: Added, Changed, Fixed, Removed, Security
- Write each entry as a single sentence describing the user-facing impact, not the code change
- BAD: "Refactored auth middleware to use async/await"
- GOOD: "Fixed session expiry not being enforced on API routes"
- Skip pure refactors, typo fixes, and CI config changes unless they affect behavior
- Include the commit hash in parentheses after each entry
- If a commit message is unclear, read the diff to understand the actual change:
  use `git show <hash> --stat` to check

## Output format
[version] - YYYY-MM-DD

Added
- Entry here (...)

Fixed
- Entry here (...)

Output the changelog in markdown. Do not commit or modify any files.
Here's /changelog generating release notes from the project's commit history:
It read all 11 commits, inspected each diff to understand the actual change (not just the commit message), and grouped them into Added, Fixed, and Infrastructure categories.
Each entry describes the user-facing impact rather than the code change, like "Single prediction endpoint with request logging" instead of "add predict route and logger service."
It also included commit hashes so you can trace any entry back to the exact diff. The summary at the end ties the commits together into a narrative of what was built and what's in progress.
Setting up your first command takes three steps:
For commands you want across all your projects (like orient or preflight), put them in ~/.claude/commands/ and invoke with /command-name.
Also, the commands in this article are intentionally opinionated. They encode specific preferences about code review priorities, test patterns, commit hygiene, and documentation style. You can fork them and adjust according to your use cases.
But the value isn't in the exact prompts, but the takeaway here is in the pattern. Identify the instructions you keep retyping, save them as a file, and iterate on the prompt until the output consistently matches what you'd do manually.
One thing to note: Anthropic has since introduced .claude/skills/ as the recommended directory for new commands. Skills support additional features like bundled supporting files, auto-invocation (Claude loads the skill automatically when it recognizes a relevant task), and subagent execution. The .claude/commands/ approach used in this article still works and is the simpler starting point.
👉 Over to you: what repetitive prompts are you typing into Claude Code that should probably be a custom command by now?
Thanks for reading!