A Practical Guide to Integrate Evaluation and Observability into LLM Apps
A comprehensive guide to Opik, an open-source LLM evaluation and observability framework.
Introduction
In previous articles, we’ve covered the foundational aspects of building and optimizing LLM-powered systems, including topics like Retrieval-Augmented Generation (RAG), multimodal integration, and model evaluation techniques.

These discussions laid the groundwork for building systems capable of sophisticated tasks.
However, as these systems scale, ensuring their performance remains robust and trustworthy becomes the real challenge. That is why building reliable and impactful LLM-powered systems requires more than just deploying a model.
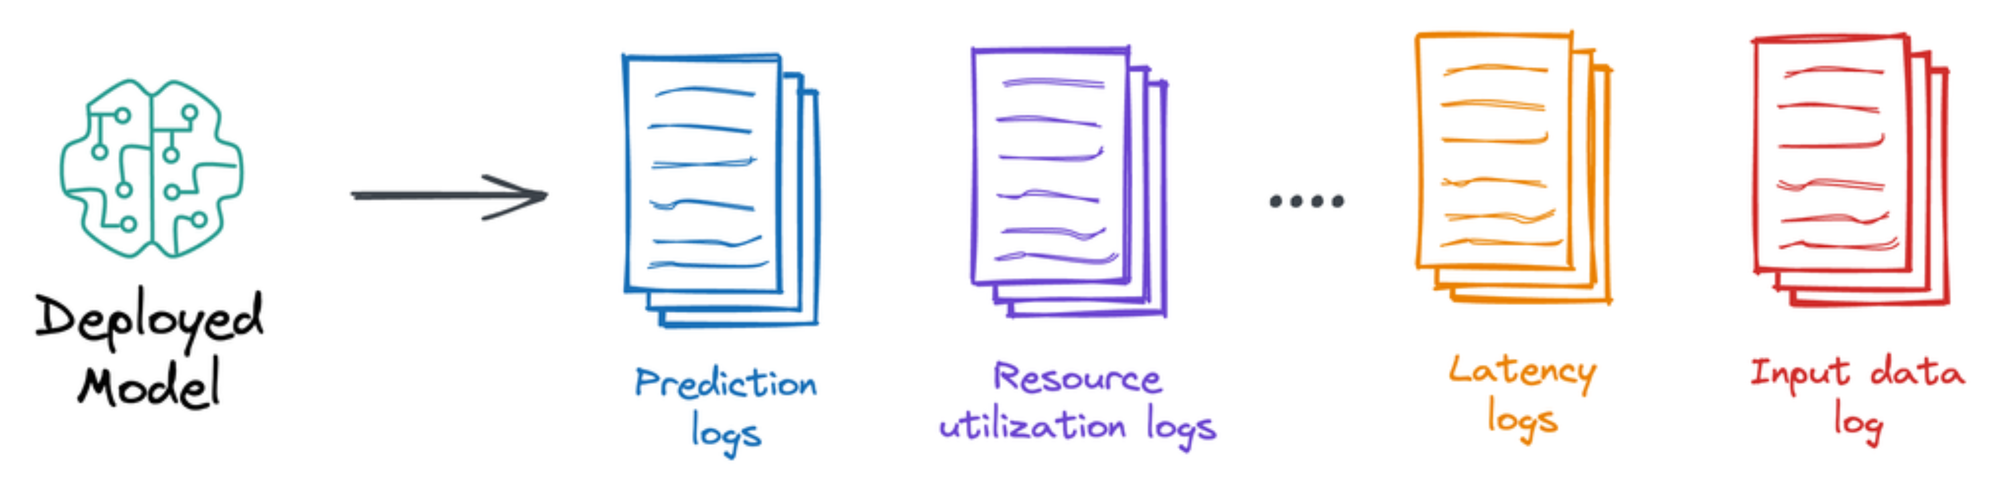
It demands continuous evaluation to ensure quality and observability so that we can identify issues post-deployment.
Thus, this article will help you develop skills to examine how evaluation and observability can work together seamlessly to make LLM applications more robust and practical:
- Evaluation ensures that the system delivers accurate, consistent, and task-relevant results.
- Observability offers a real-time view into the system’s inner workings, capturing everything from model drift to bottlenecks in performance.
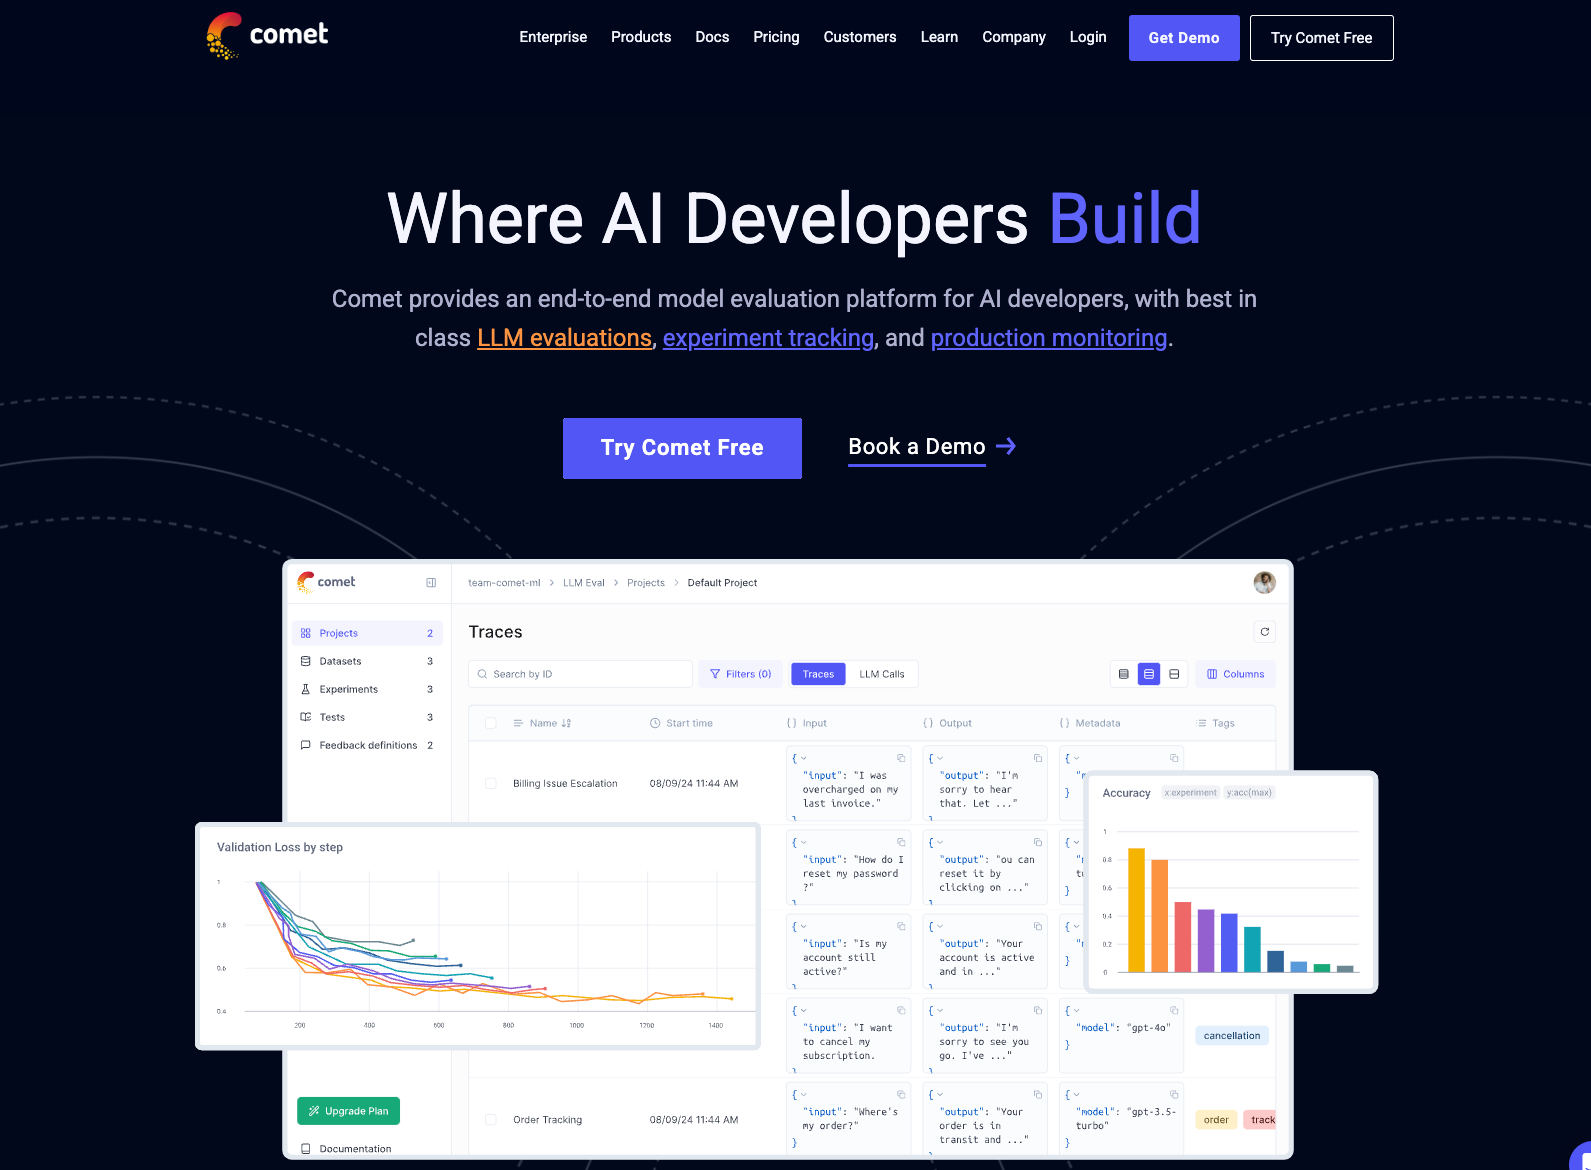
Technically speaking, the focus of this article is Opik by CometML, which is an open-source framework that provides a specialized platform to address exactly these concerns.
With Opik, we can:
- Track LLM performance across multiple metrics, including relevance, factuality, and coherence.
- Monitor system behavior in real-time, identifying areas for improvement.
- Seamlessly integrate with popular LLMs (like OpenAI or Ollama) and tools (like LlamaIndex).
This is possible because Opik offers several tools to track, evaluate, and monitor machine learning systems in production, enabling teams to bridge the gap between development and real-world deployment.
And a great part about Opik is that whether you’re using OpenAI, Ollama, or any other LLM provider, Opik makes it straightforward to monitor your applications, log every interaction, and evaluate results against predefined metrics.
Here's the outline for this article:
- We'll start by setting up the environment and configuring Opik.
- Next, we are going to trace a simple Python function so that you understand how Opik works.
- After that, we are going to track a simple LLM core so you can use the same for the AI applications that you're building.
- Moving on, we are going to build a RAG application using LlamaIndex, which we shall evaluate and monitor this application in our Opik dashboard.
Let's begin!
If you prefer to follow along with a video tutorial instead, you can watch this video below:
Below, we have the text version of the above video, along with detailed and step-by-step code instructions.
Installation and setup
We'll start by creating an account on comet.com.
You can just click on the link above and follow the instructions.
In this case, for simplicity, we'll be using a hosted version of Opik on their platform. Nonetheless, the fundamentals are going to remain the same.
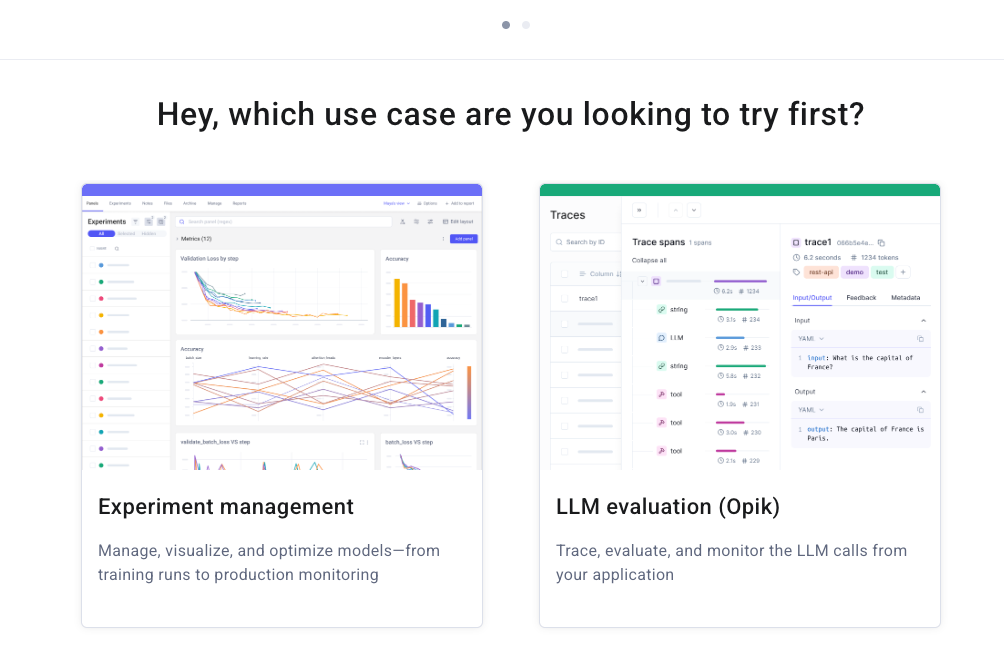
Once you will create an account, it will give you two options to choose from—select LLM evaluation (Opik):
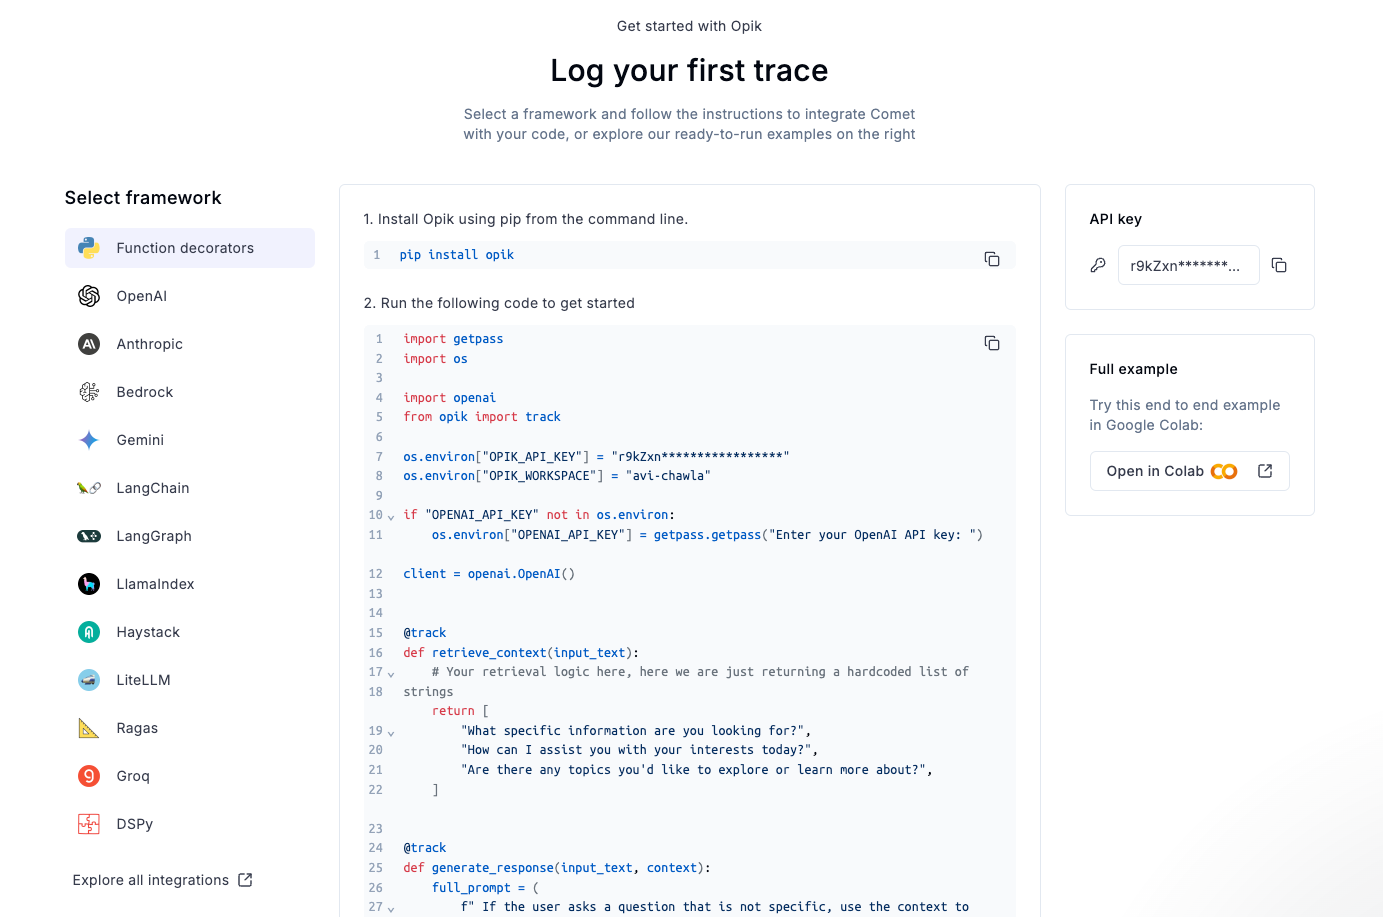
Once done, you will find yourself in this dashboard, where you can also find your API key on the right:
Next, in your current working directory, create a .env file:
Copy the API key shown in your dashboard and paste it as follows:
To configure Opik, run the following code.
Executing the above code will open a panel to enter the API key obtained above. Enter the API key there, and done—Opik has been configured.
In some parts of this article, we will be using a locally running model using Ollama. Ollama provides a platform to run LLMs locally, giving you control over your data and model usage.
Here's a step-by-step guide on using Ollama.
- Go to Ollama.com, select your operating system, and follow the instructions.
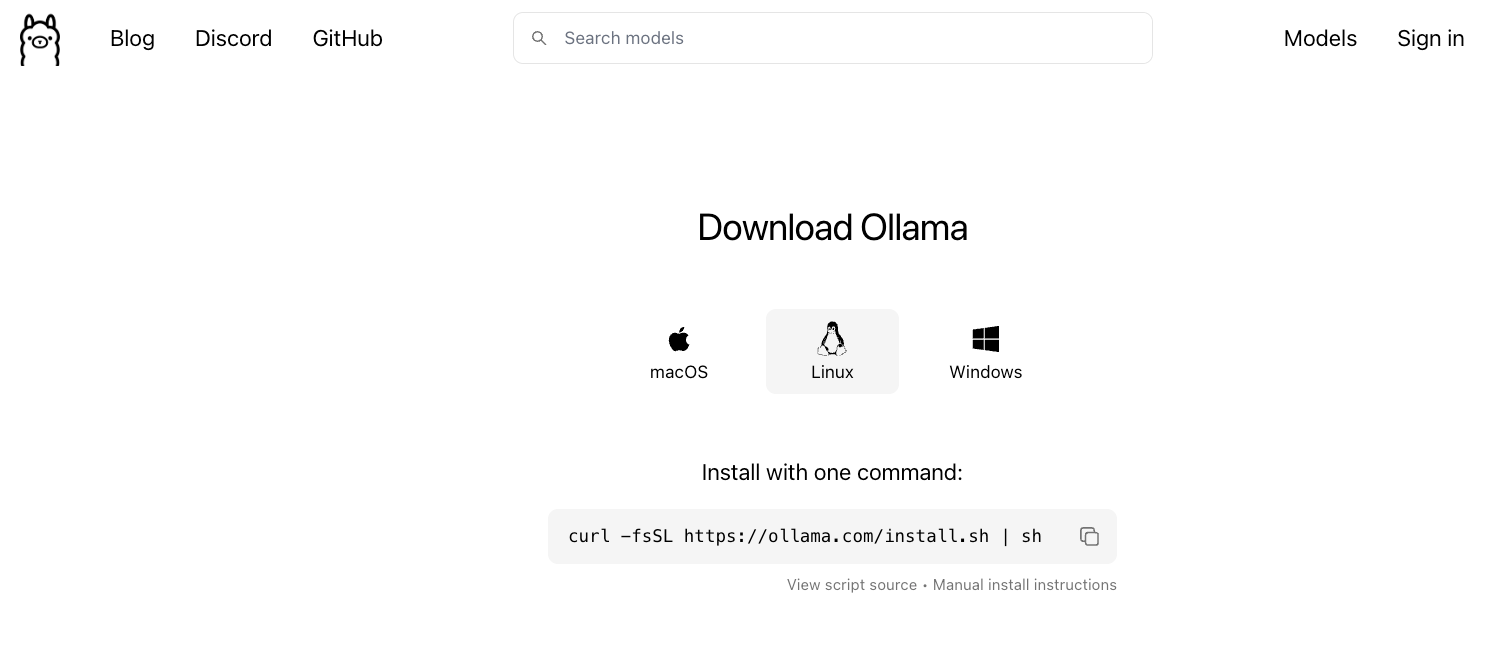
- If you are using Linux, you can run the following command:
- Ollama supports a bunch of models that are also listed in the model library:

Once you've found the model you're looking for, run this command in your terminal:
The above command will download the model locally, so give it some time to complete. But once it's done, you'll have Llama 3.2 3B running locally, as shown below which depicts Microsoft's Phi-3 served locally through Ollama:
That said, for our demo, we would be running the Llama 3.2 1B model instead since it is smaller and will not take much memory:
Finally, install the open-source Opik framework, LlamaIndex, and LlamaIndex's Ollama integration module as follows:
Setup and installation are done!
Data
Next, download the dataset as follows:
The above code will create a data folder in your current working directory.
Getting started with Opik
When it comes to monitoring machine learning workflows, simplicity is key.
In this respect, Opik offers an intuitive way to track and log your experiments, which can include advanced applications like Retrieval-Augmented Generation (RAG) pipelines or multi-agent systems.
Let’s dive into a quick demo to see how Opik simplifies the process.
Tracking a Simple Python Function
Let's start with a simple demo.
Imagine we want to track all the invocations to this simple Python function specified below:
To do this, Opik provides a powerful @track decorator that makes tracking a Python function effortless.
That's it!
By wrapping any function with this decorator, you can automatically trace and log its execution inside the Opik dashboard.
For instance, currently, our dashboard does not show anything.
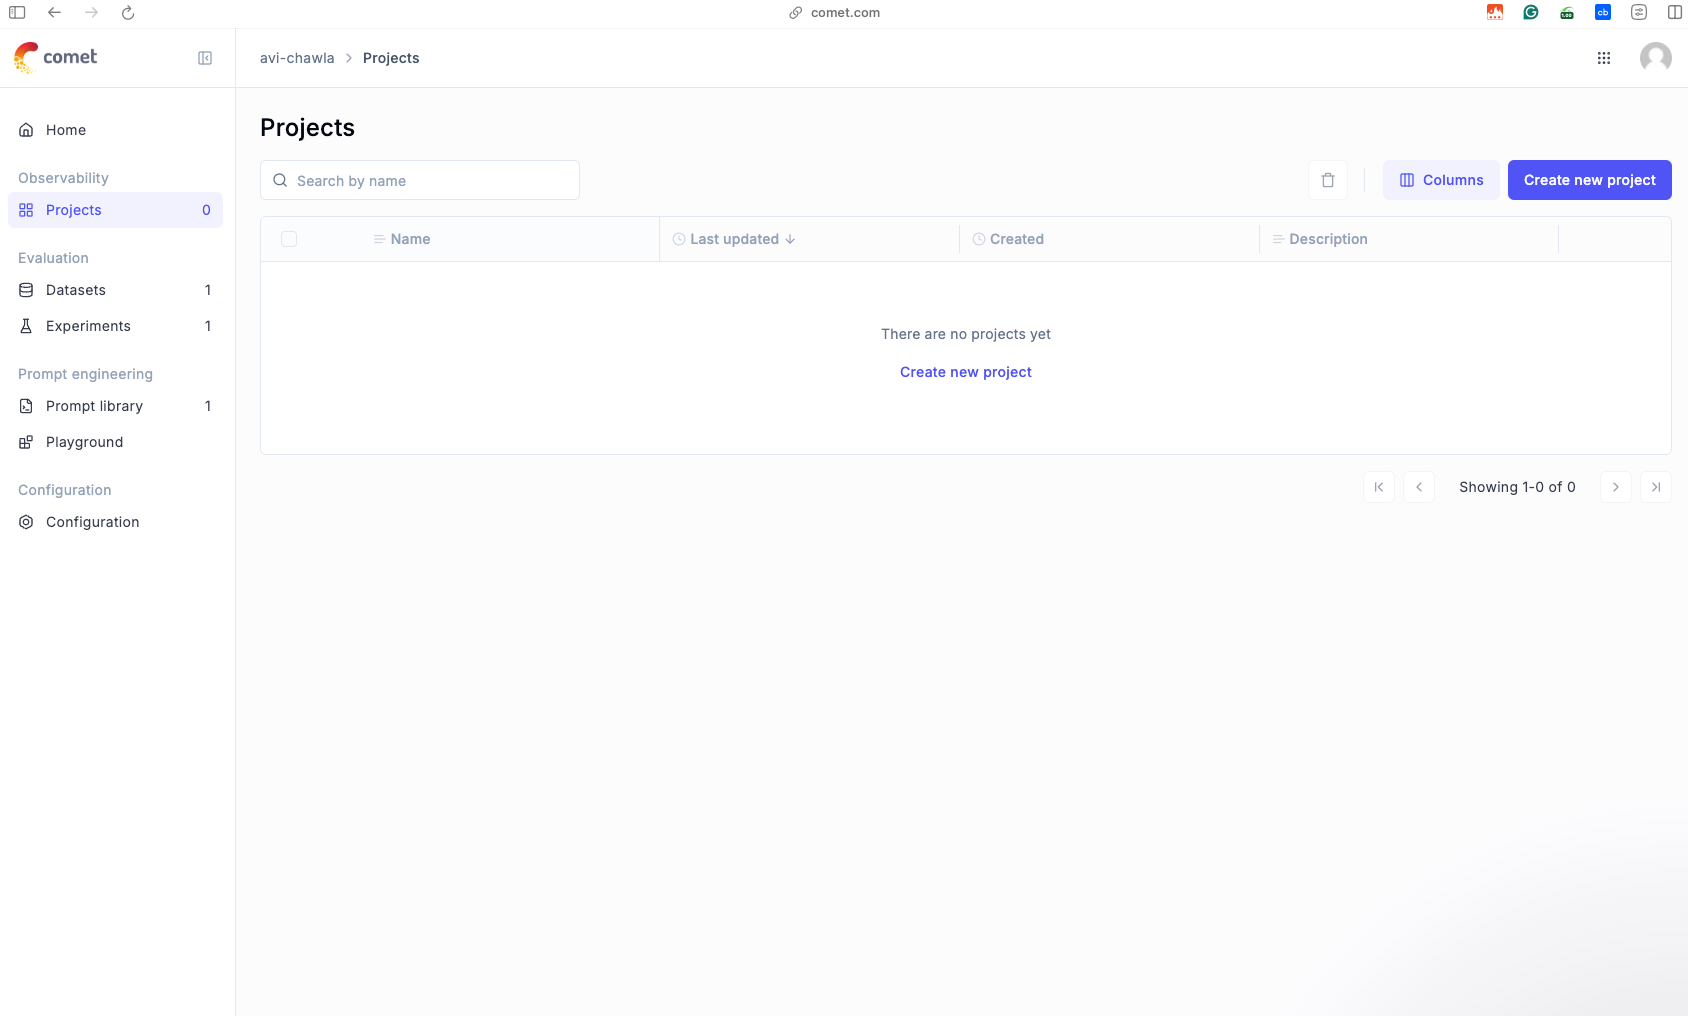
If we run the above code, which is decorated with the @track decorator, and after that, we go to the dashboard, we will find this:
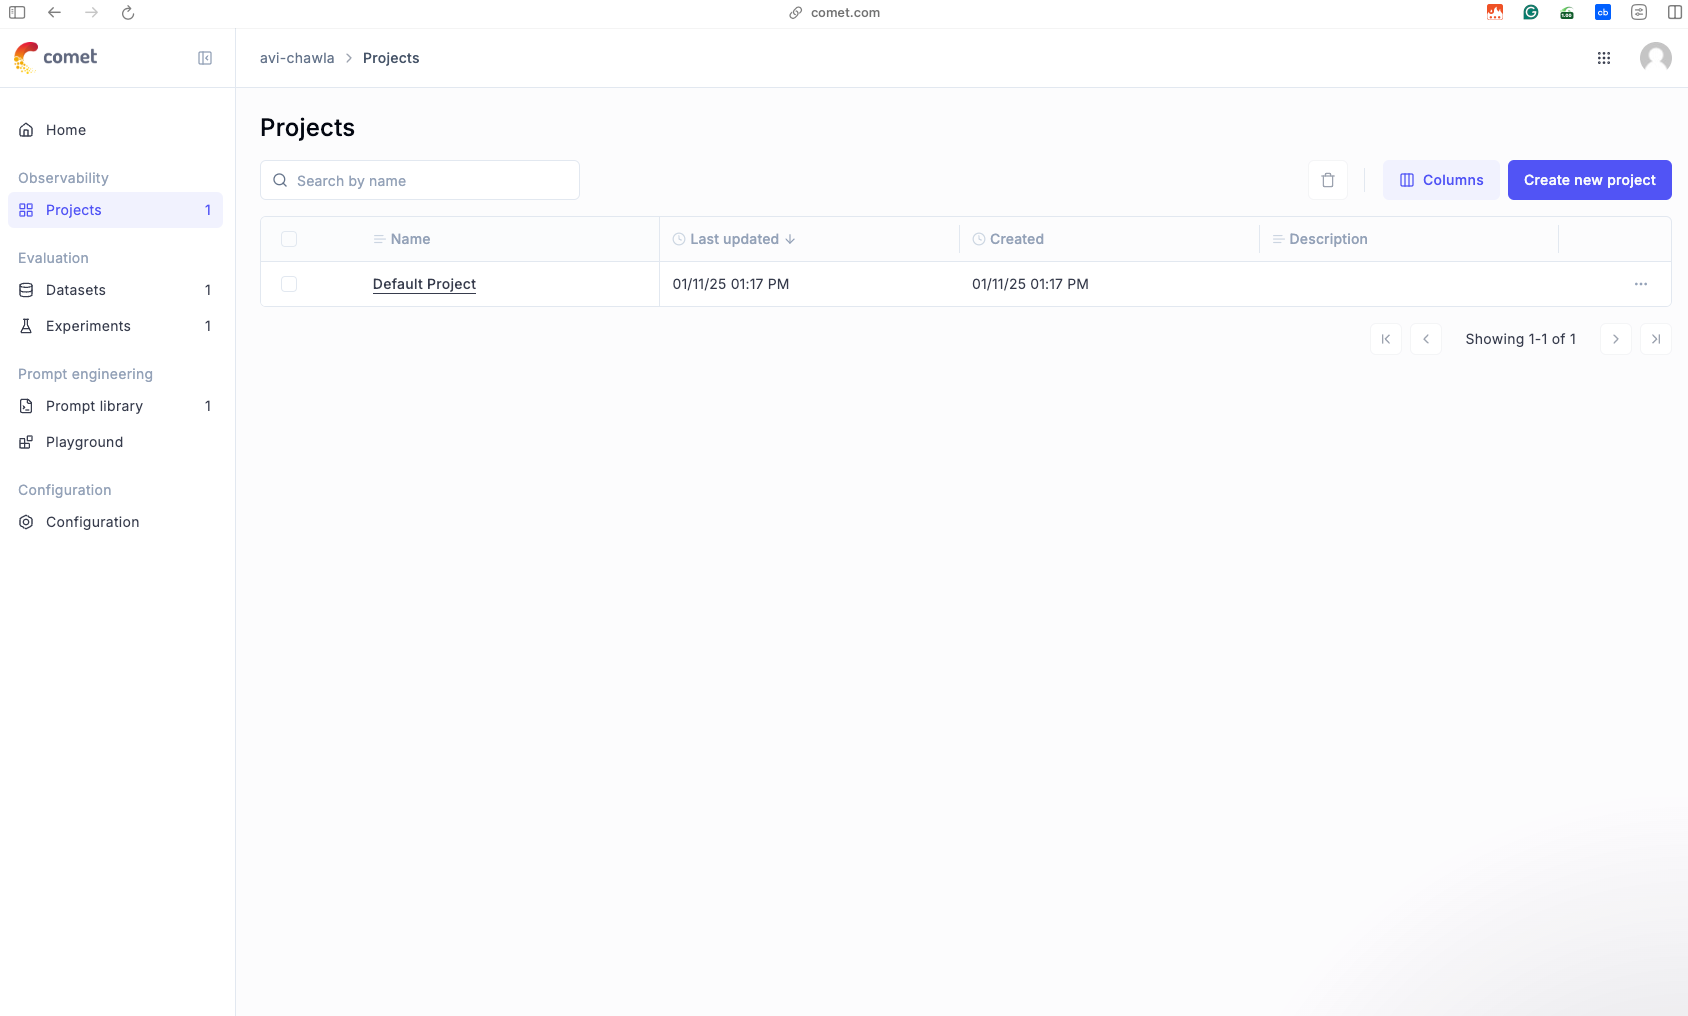
As depicted above, after running the function, Opik automatically creates a default project in its dashboard.
In this project, you can explore the inputs provided to the function, the outputs it produced, and everything that happened during its execution.
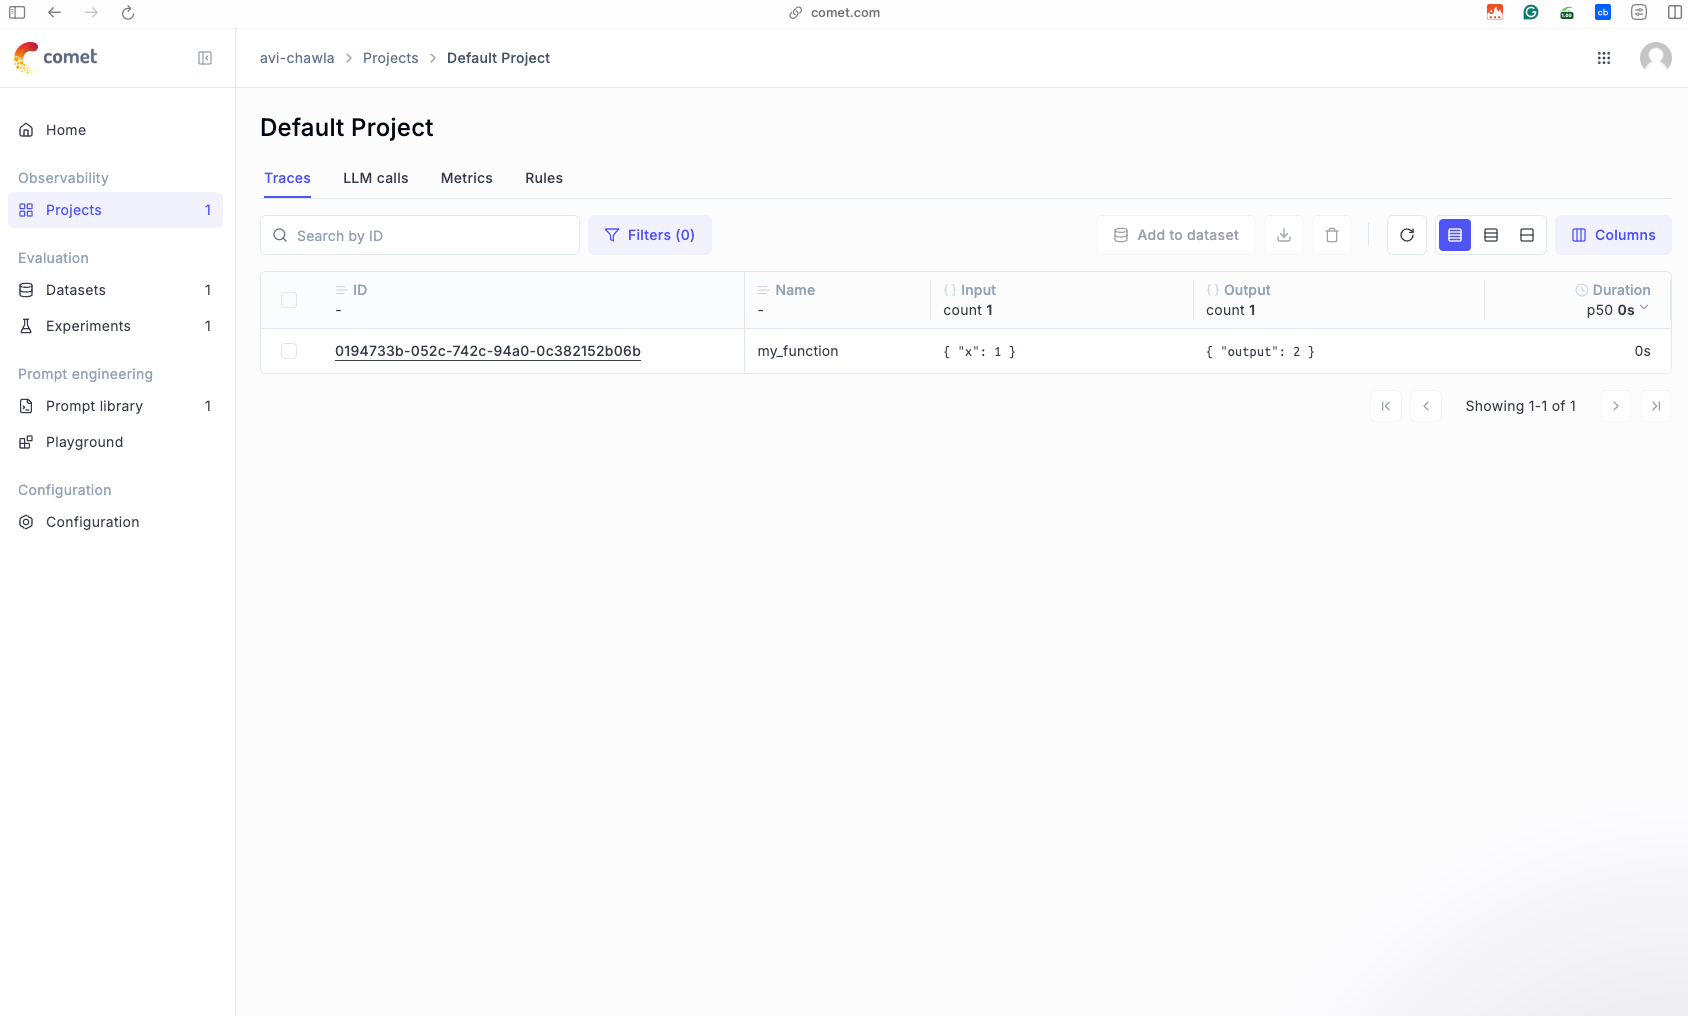
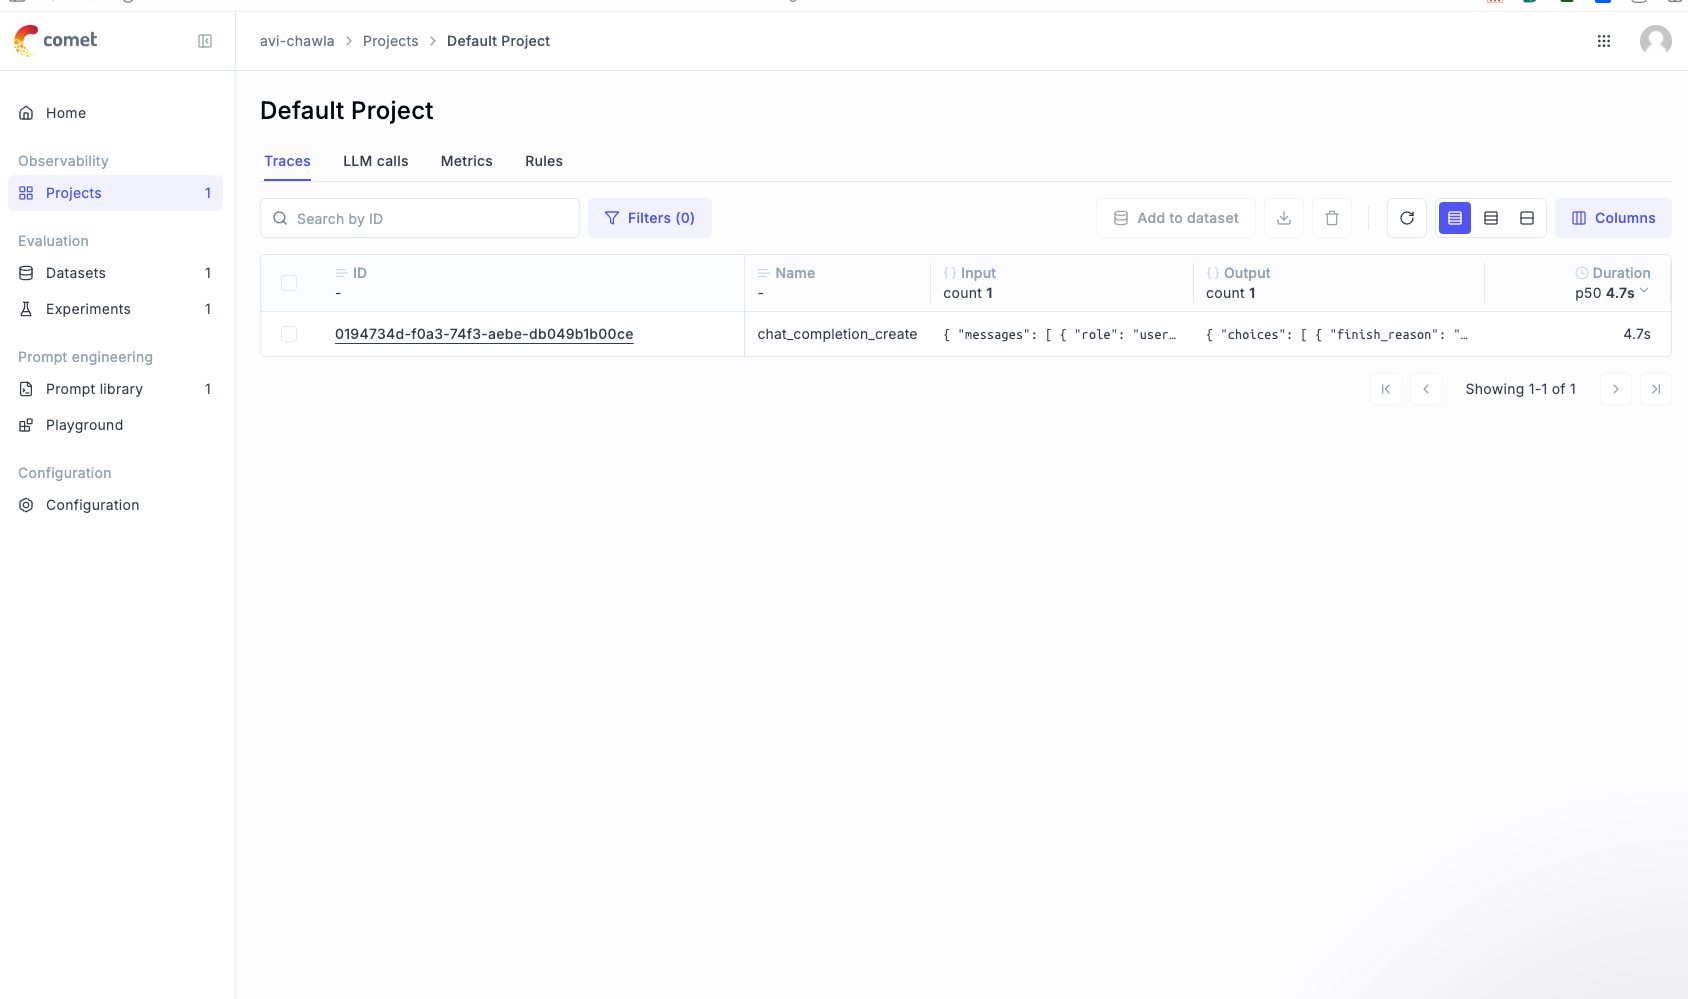
For instance, once we open this project, we see the following invocation of the function created above, along with the input, the output produced by the function, and the time it took to generate a response.
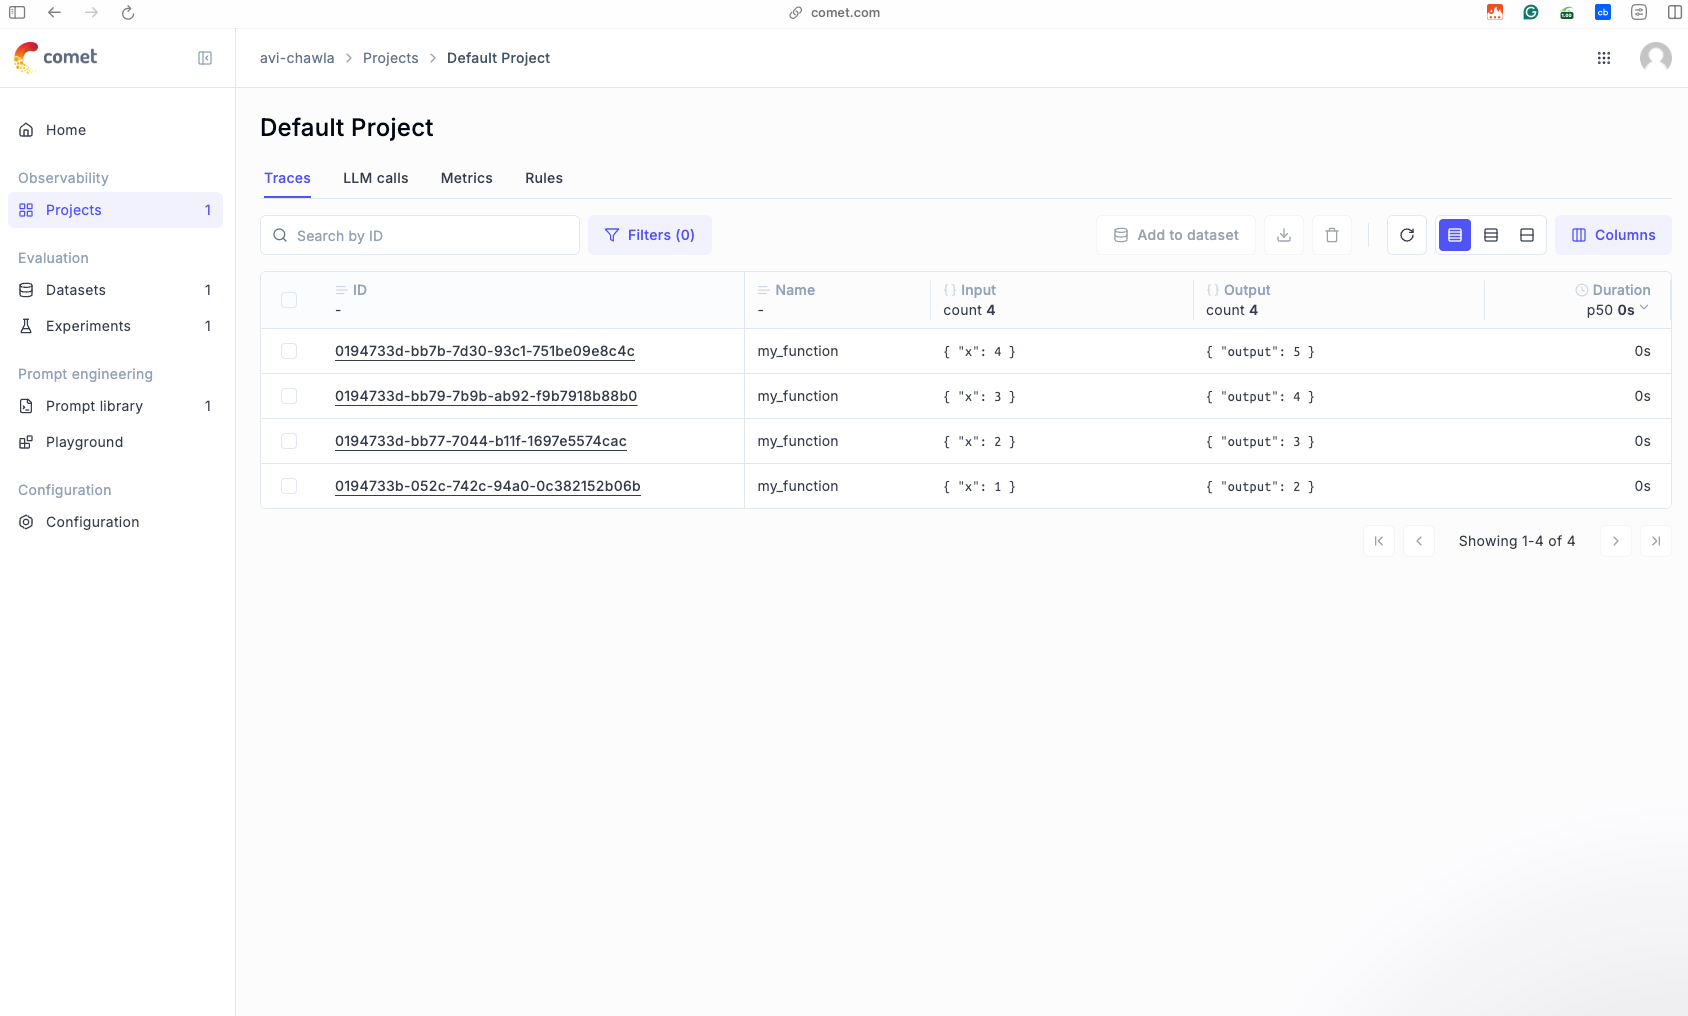
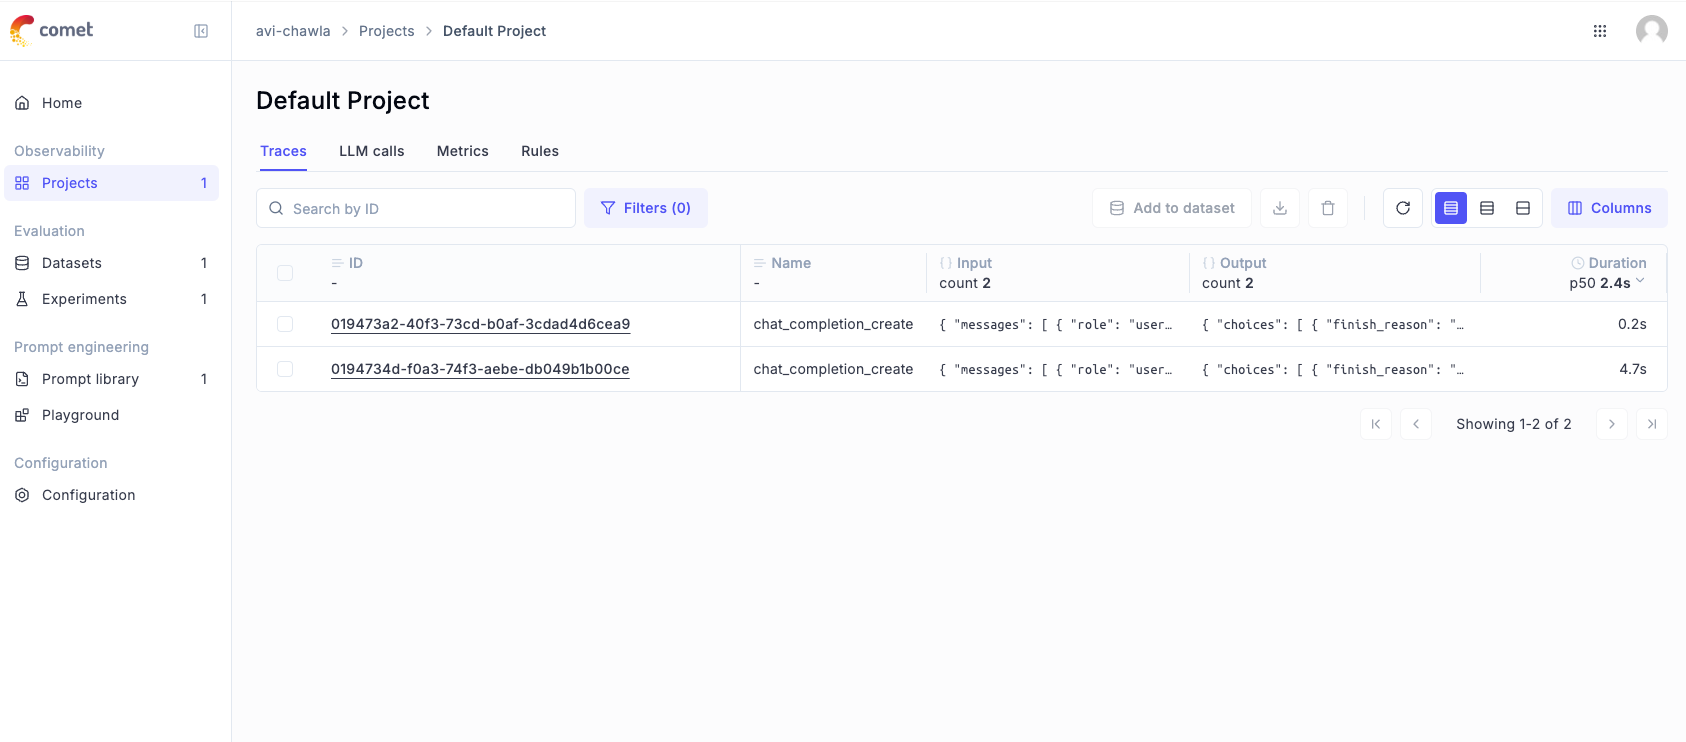
Also, if you invoke this function multiple times, like below...
...the dashboard will show all the invocations of the functions:
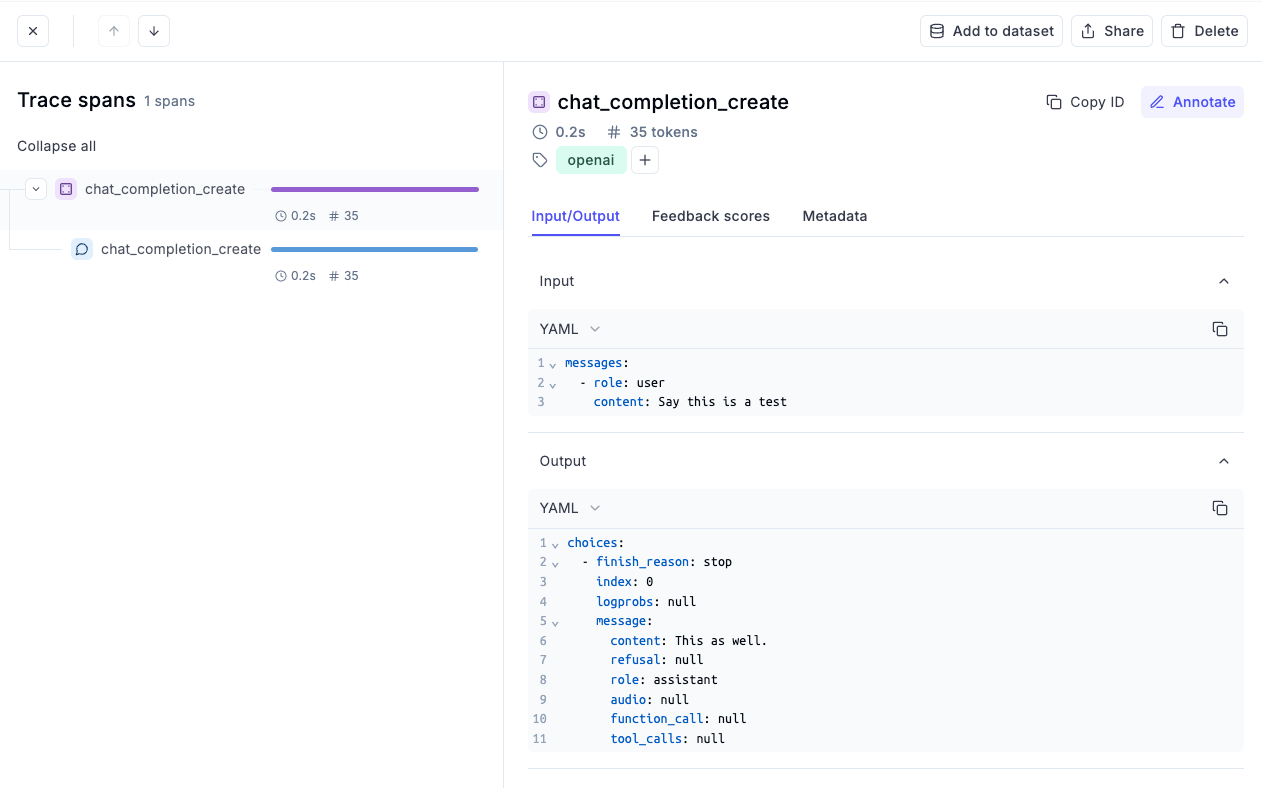
Opening any specific invocation, we can look at the inputs and the outputs in a clean YAML format, along with other details that were tracked by Opik:
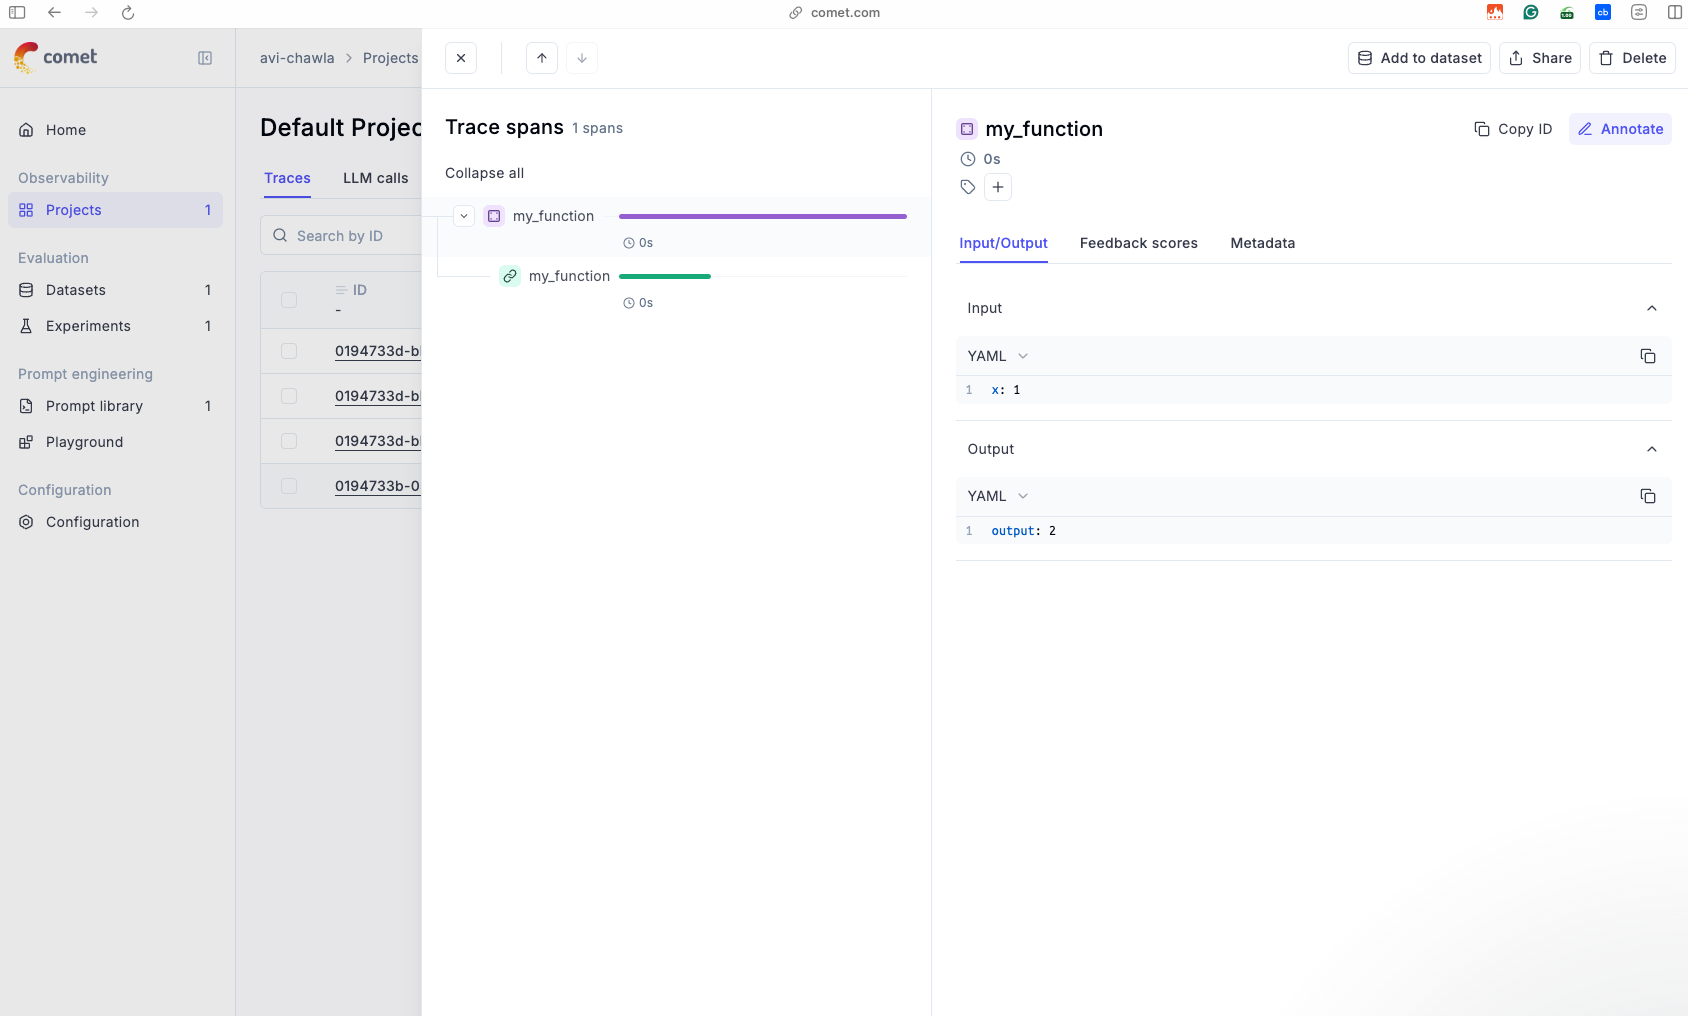
This seamless integration makes it easy to monitor and debug your workflows without adding any complex boilerplate code.
To recap, these are the steps:
- Define Your Function: Start with any Python function—whether it’s as simple as adding two numbers or as complex as an LLM-based application.
- Apply the
@trackDecorator: Add the@trackdecorator to the function definition. - Run and Observe: Execute the function, and the inputs, outputs, and other relevant data will be captured and displayed on the dashboard.
The true power of Opik lies in its flexibility. While this demo showcased a simple function, the same tracking capabilities can be extended to much more complex systems:
- RAG applications: Track every step of your Retrieval-Augmented Generation pipeline, from query formulation to retrieval and final generation.
- Multi-agent orchestration: Monitor interactions and outputs in applications involving multiple agents working together to solve a task.
All you need to do is wrap the relevant logic in a Python function and apply the @track decorator. It’s that straightforward.
Having understood how to track simple Python functions, the next step is to explore how Opik can be used to track LLM calls to monitor every interaction with large language models, analyze their performance, and gain actionable insights.
Let's do that below.
Tracking LLM calls with Opik
The purpose of this section is to show how Opik can log and monitor the interaction when the input includes both text and an image URL.
Before diving into Ollama, let's do a quick demo with OpenAI.
You would need an OpenAI API key for this, which you can get here: OpenAI API key.
Specify this in the .env file we created above as follows:
To load these API keys into your environment, run these:
Next, we shall be using Opik's OpenAI integration for this demo, which is imported below, along with the OpenAI library:
Moving on, we wrap the OpenAI client with Opik’s track_openai function. This ensures that all interactions with the OpenAI API are tracked and logged in the Opik dashboard. Any API calls made using this client will now be automatically monitored, including their inputs, outputs, and associated metadata.
Next, we define our multimodal prompt input as follows:
Finally, we invoke the chat completion API as follows:
Here, we make the API call using the chat.completions.create method:
model: Specifies the LLM to use (gpt-4o-miniin this case).messages: Provides the multimodal input we defined earlier.max_tokens: Limits the number of tokens in the output to 300, ensuring the response remains concise.
Yet again, if we go back to the dashboard, we can see the input and the output of the LLM:
Opening this specific run highlights so many details about the LLM invocation, like the input, the output, the number of tokens used, the cost incurred for this specific run, and more.
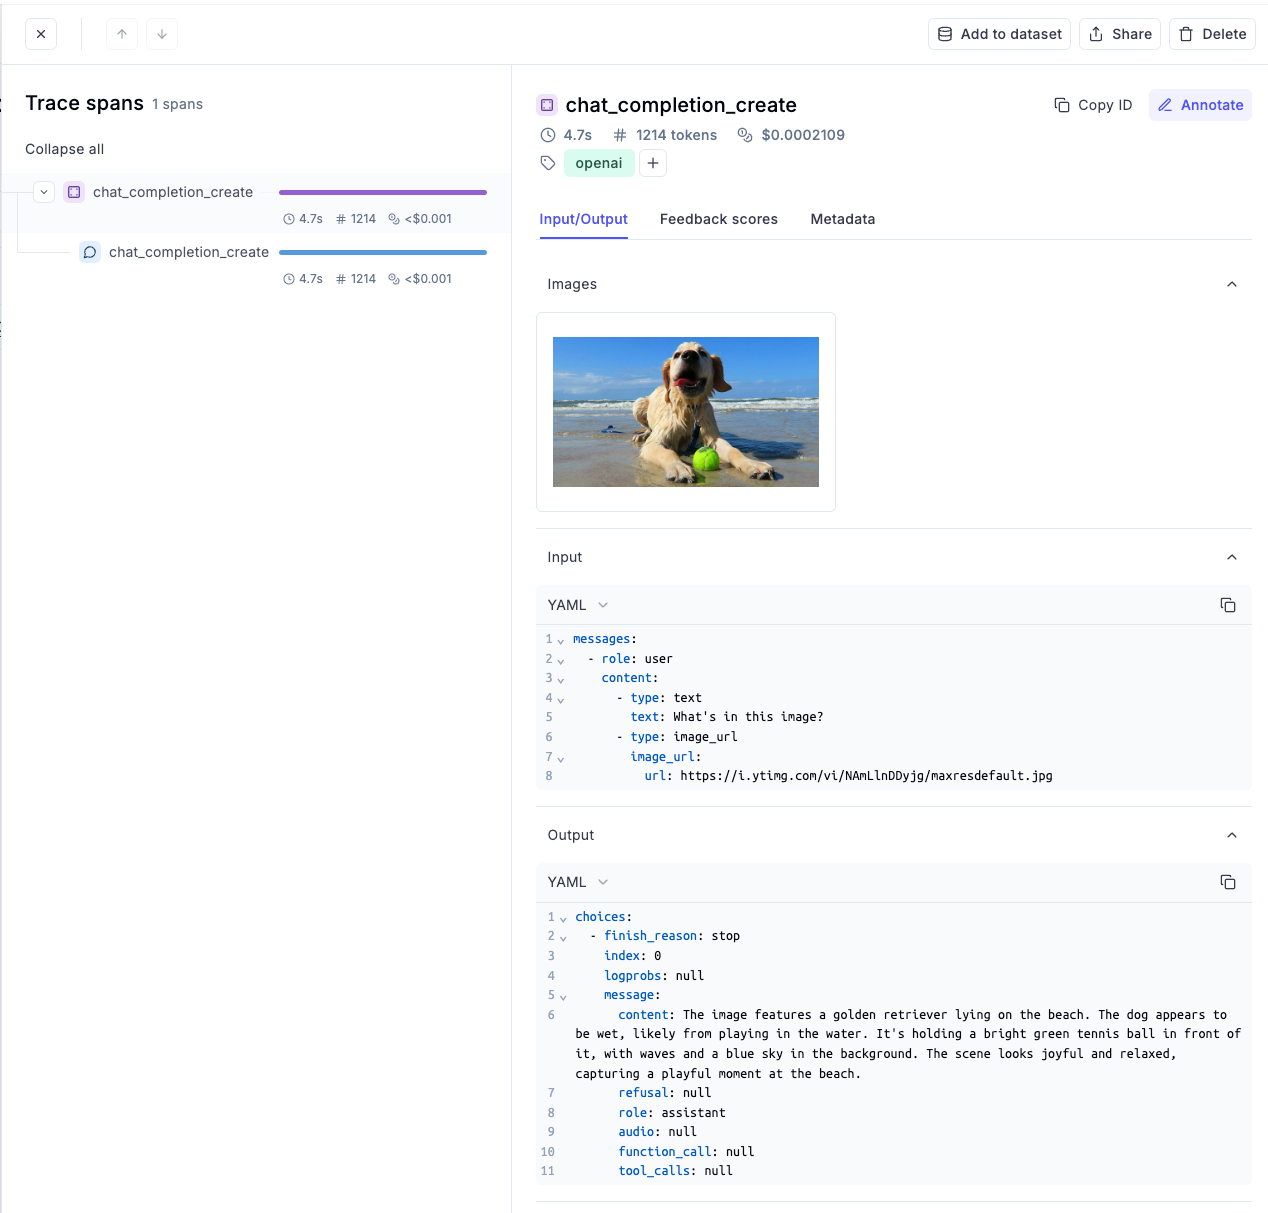
This shows that by using track_openai, every input, output, and intermediate detail is logged in the Opik dashboard, for improved observability.
We can also do the same with Ollama for LLMs running locally.
Here's a quick demo.
The process remains almost the same.
We shall again use Opik's OpenAI integration for this demo, which is imported below, along with the OpenAI library:
Next, we again create an OpenAI client, but this time, we specify the base_url as https://localhost:11434/v1:
Next, to log all the invocations made to our client, we pass the client to the track_openai method:
Finally, we invoke the completion API as follows:
If we head over to the dashboard again, we see another entry:
Opening the latest (top) invocation, we can again see similar details like we saw with OpenAI—the input, the output, the number of tokens used, the cost, and more.
That was simple, wasn't it?
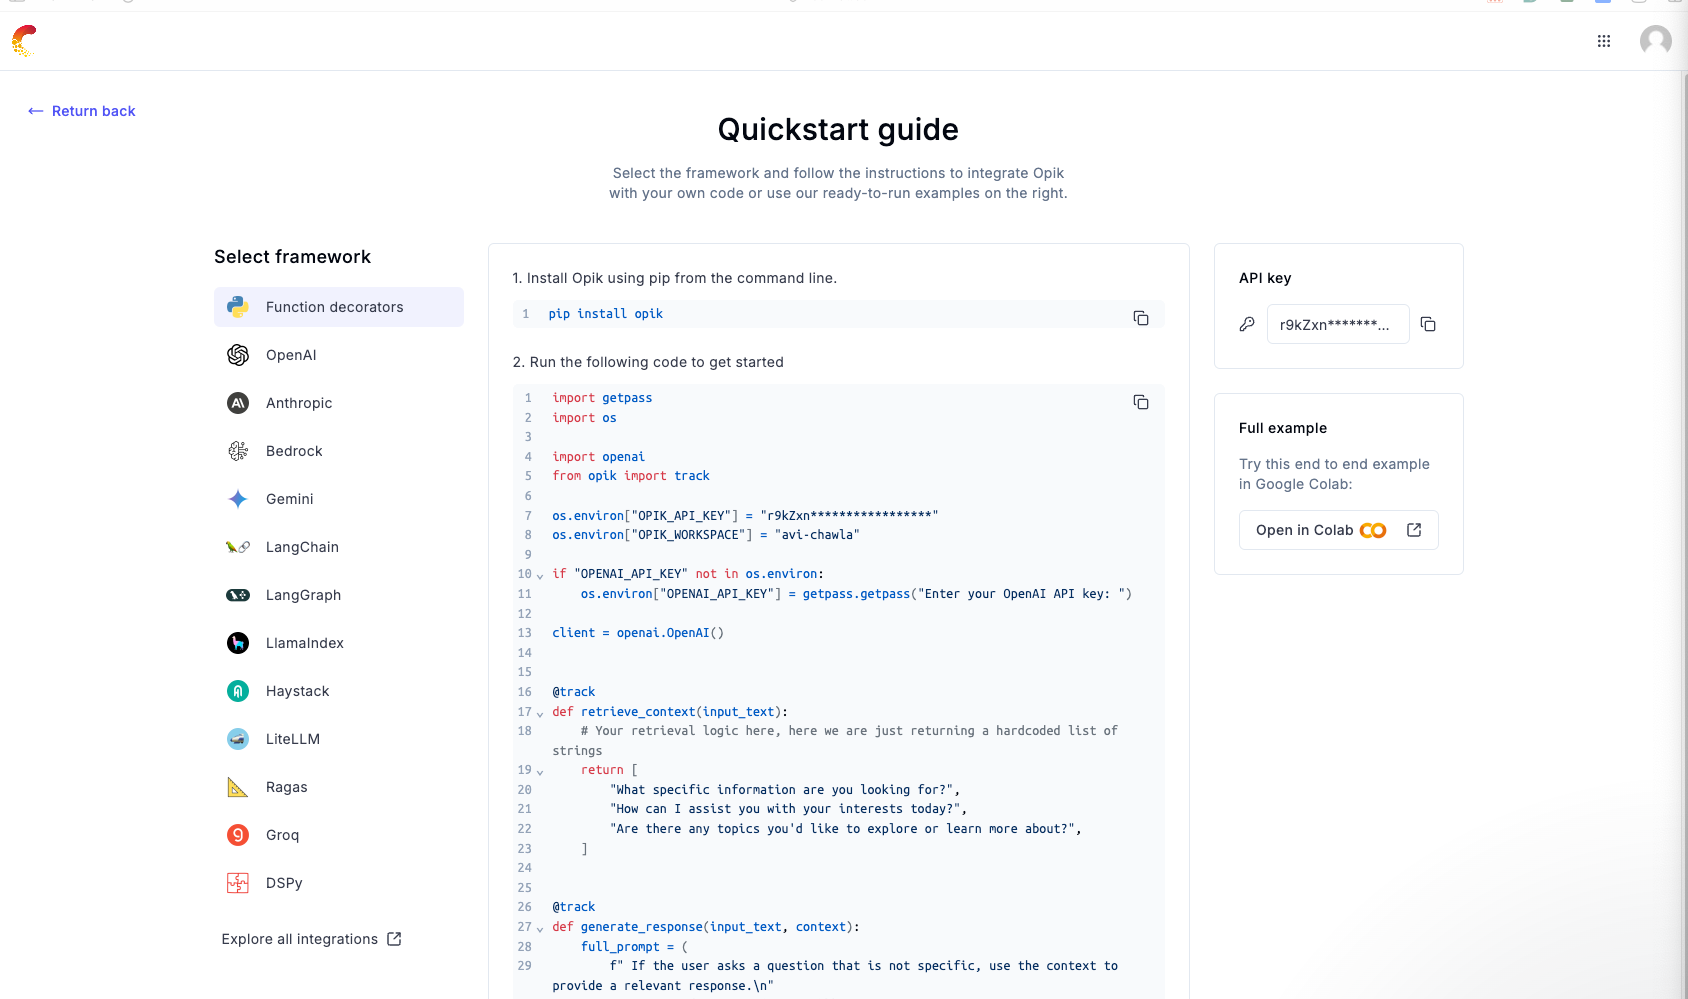
All the supported integrations and how to use them in your projects are available in the quickstart guide.
Experiment tracking with Opik
Now that we’ve seen how Opik works, it’s time to unlock its true potential by using it to evaluate and monitor LLM applications.
This involves creating an evaluation dataset, designing an experiment, and using Opik to track and analyze the results step by step.
Workflow
Here’s the workflow for setting up an evaluation experiment with Opik:
- Define the Dataset:
- We’ll start by preparing a dataset for evaluation.
- This dataset will include input queries and their corresponding expected outputs.
- This will allow us to measure how well the LLM application performs across several parameters like coherence, factfullness, etc. We discussed all of these metrics in detail in Part 2 of our RAG crash course series:

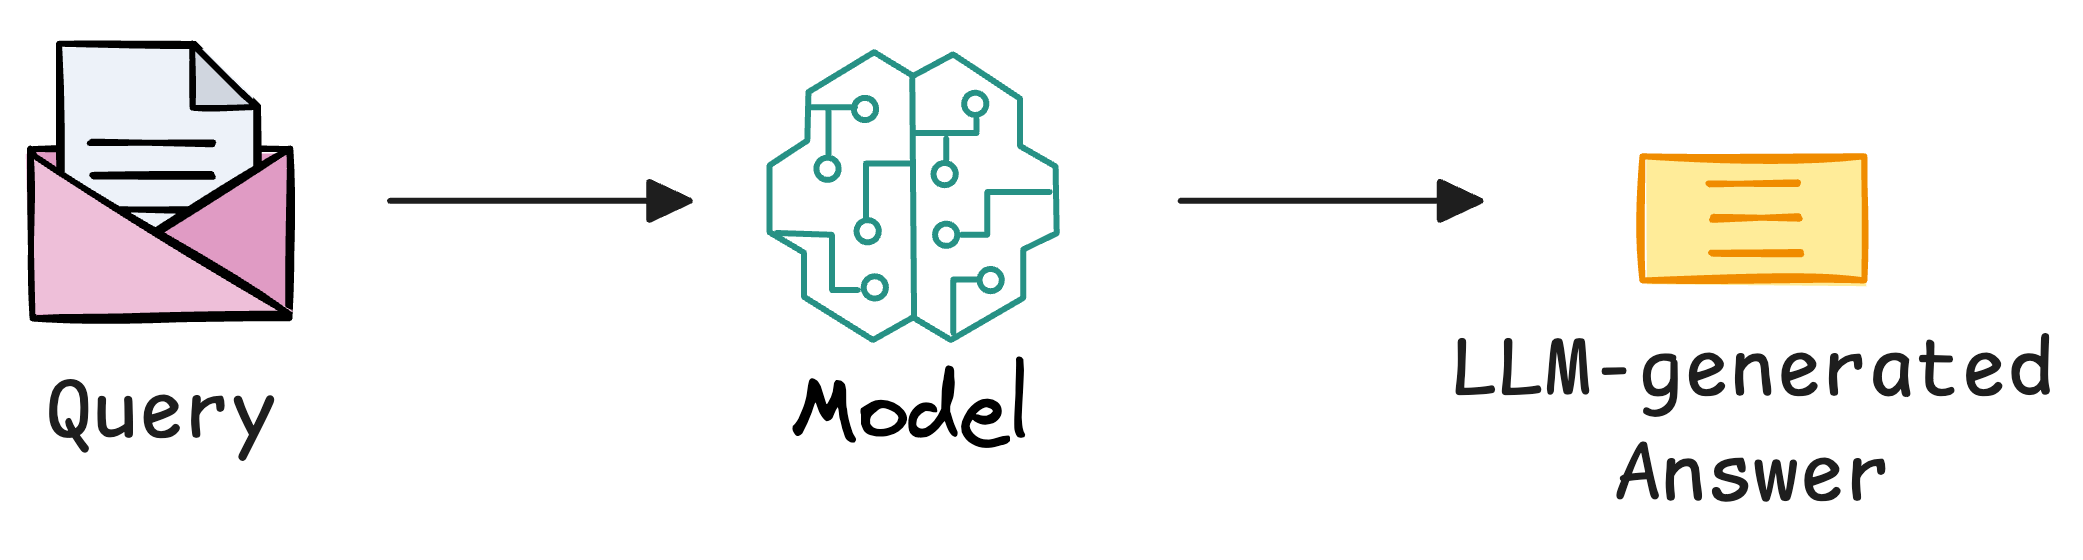
- Run the Experiment:
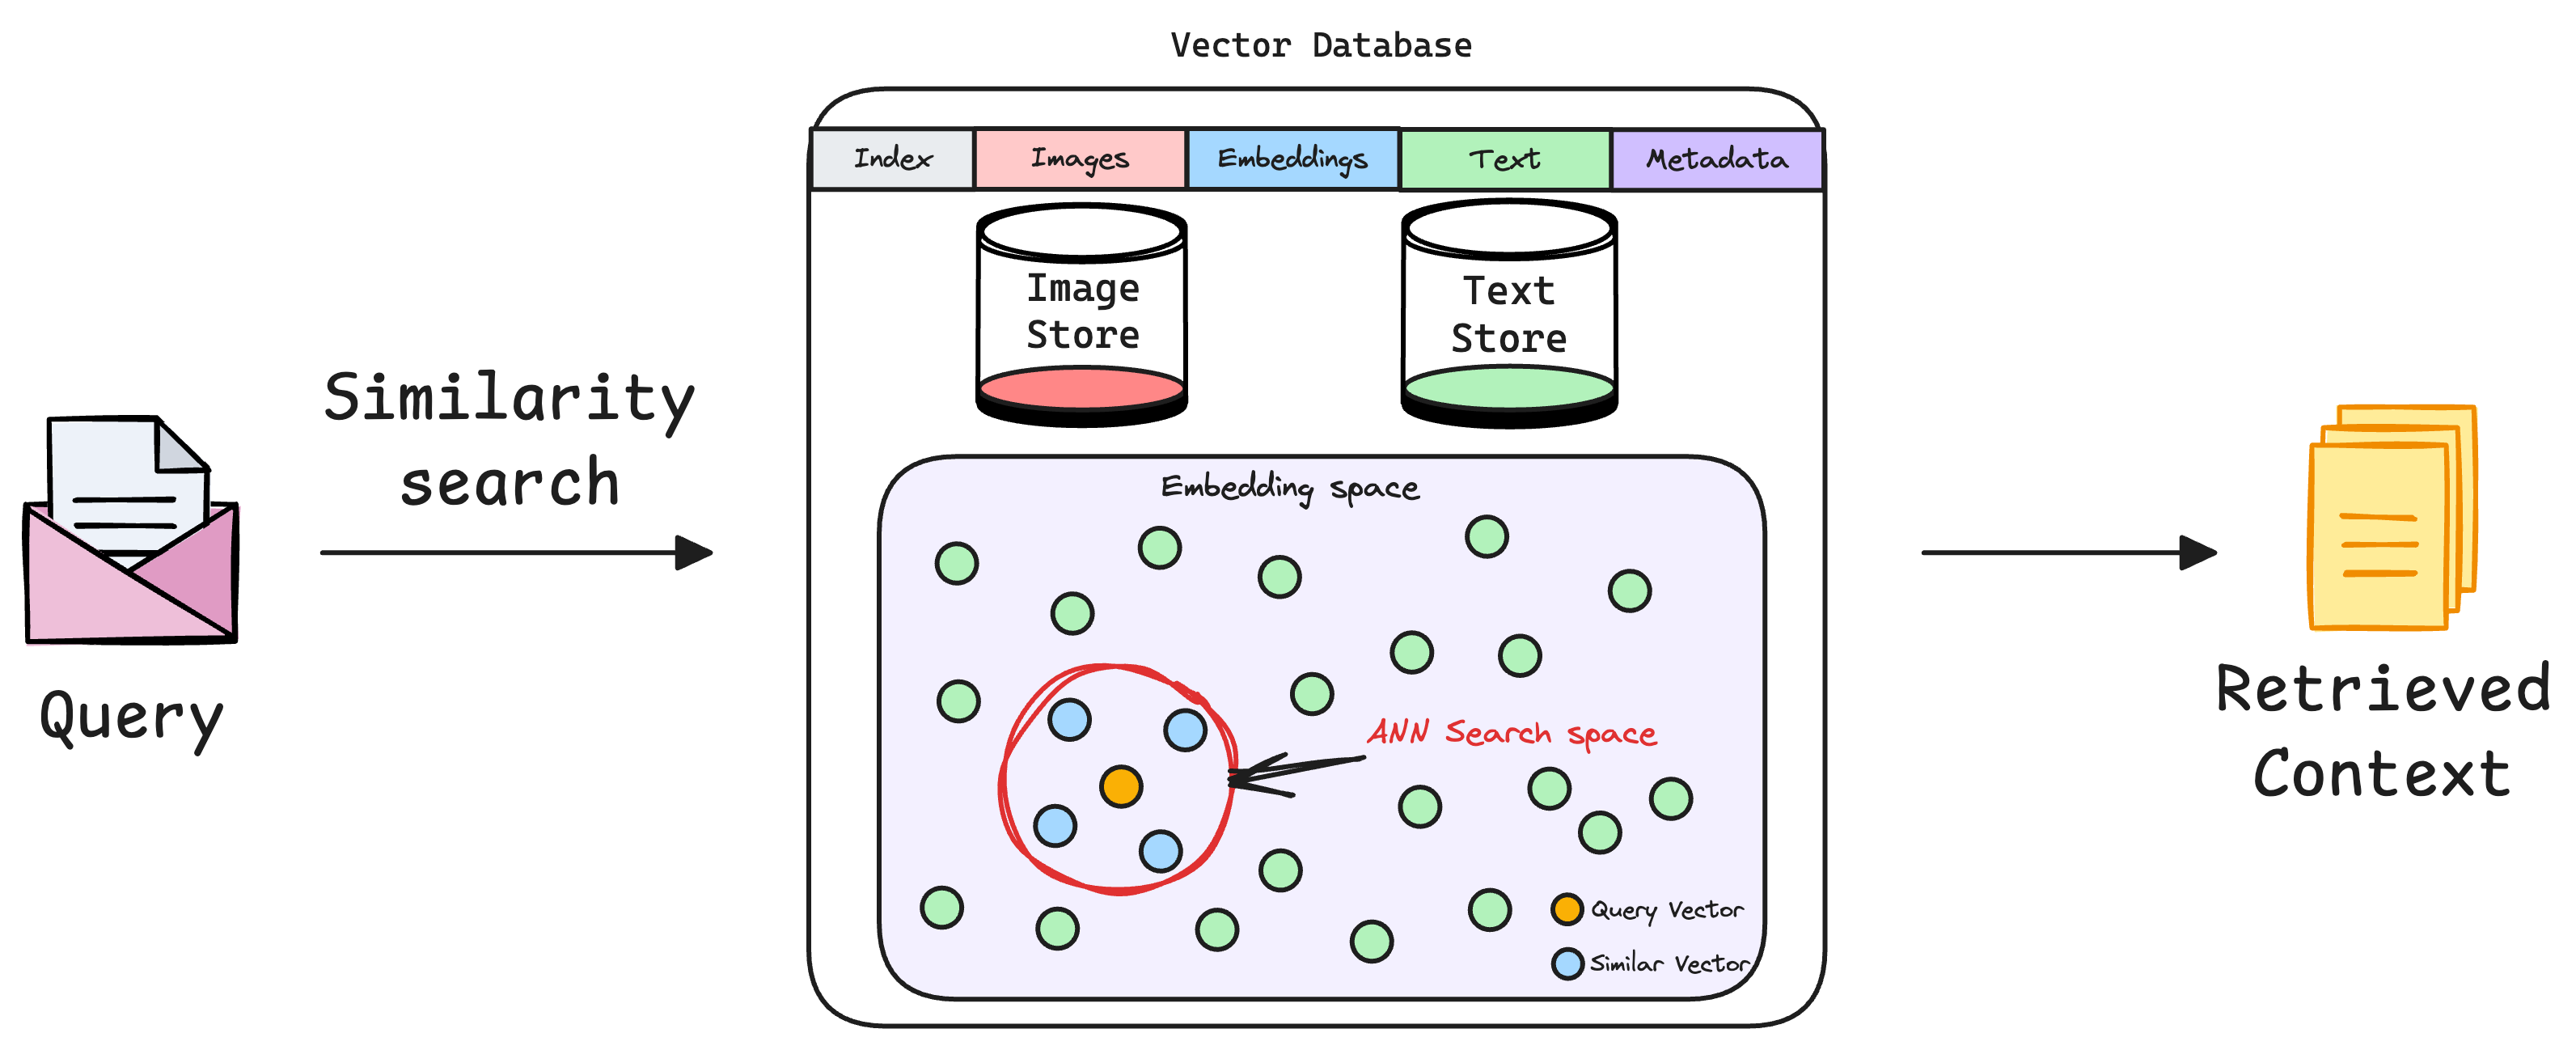
- Each query item will be processed through the RAG application to produce a response
- During the retrieval process, we must have retrieved some context from the vector database before generating the response:
- Thus, the application’s output will then be compared to the expected output using predefined evaluation metrics, generating a feedback score. Moreover, we shall compare the expected context with the retrieved context to evaluate the retrieval pipeline.
- Track the Experiment:
- Everything that happens within the above process is treated as an experiment.
- Opik will trace and monitor the experiment, logging inputs, outputs, and scores for each dataset item in its dashboard for easy analysis.
Data
To run this experiment, we need some data, which we already downloaded earlier:
The above code will create a data folder in your current working directory.
Integrate LlamaIndex with Opik
Since we would be using LlamaIndex to build a RAG pipeline shortly, the next step is to integrate LlamaIndex with Opik.
This integration enables tracking all LlamaIndex operations like document chunking and ingestion to generate and retrieve queries.
To enable this tracking, you need to configure an Opik callback handler. This handler acts as a bridge between LlamaIndex and Opik, logging all operations in real time.
First, you’ll need to import Settings and CallbackManager from LlamaIndex, along with the LlamaIndexCallbackHandler from Opik:
Next, we create an instance of LlamaIndexCallbackHandler, which automatically logs all LlamaIndex operations to Opik.
Finally, we use LlamaIndex’s Settings to integrate the callback handler via the CallbackManager. This ensures that every operation performed by LlamaIndex is tracked.
Done!
With Opik’s integration for LlamaIndex, we can now focus on building a simple RAG application without worrying about tracking or monitoring manually.
Build a RAG application
Once LlamaIndex is integrated with Opik, the next logical step is to create a basic RAG pipeline.
Also, going ahead, our idea is to keep everything simple and focus on what's important, which is evaluation and observability.
This code below demonstrates how you can use LlamaIndex to load documents, build an index, and query it for insights.
We start with the necessary imports:
Next, we do the following:
- We use the
SimpleDirectoryReaderfrom LlamaIndex to read all the documents from the directory created above during data download. - With the documents loaded, the
VectorStoreIndexis created to serve as the foundation for efficient retrieval. This index maps document content into a vector space stored in memory. - Once the index is ready, a query engine is created to perform semantic searches and answer specific questions based on the indexed data.
Done!
Next, we query our RAG pipeline as follows, which produces a response:
Yet again, if we go back to the dashboard, we see two things here:
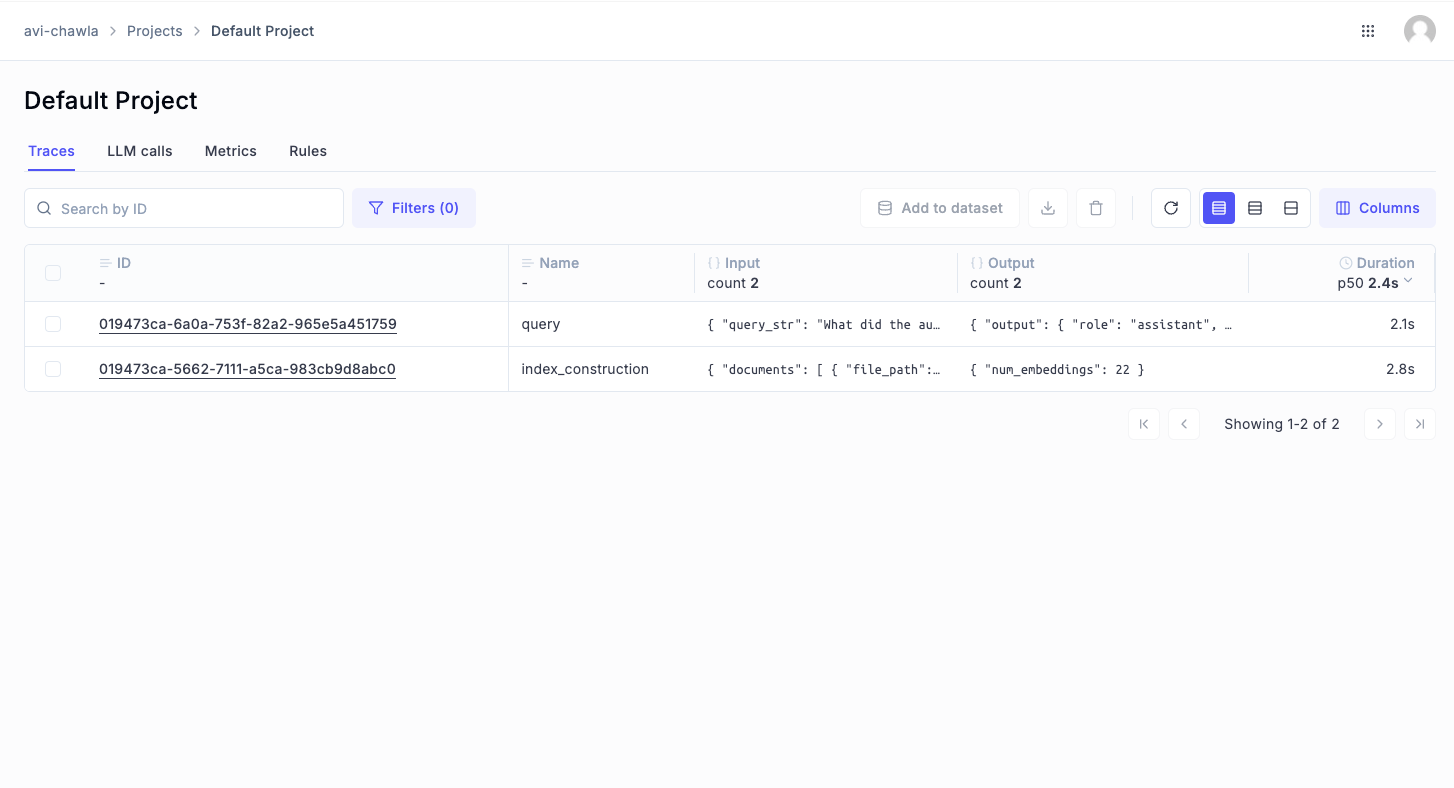
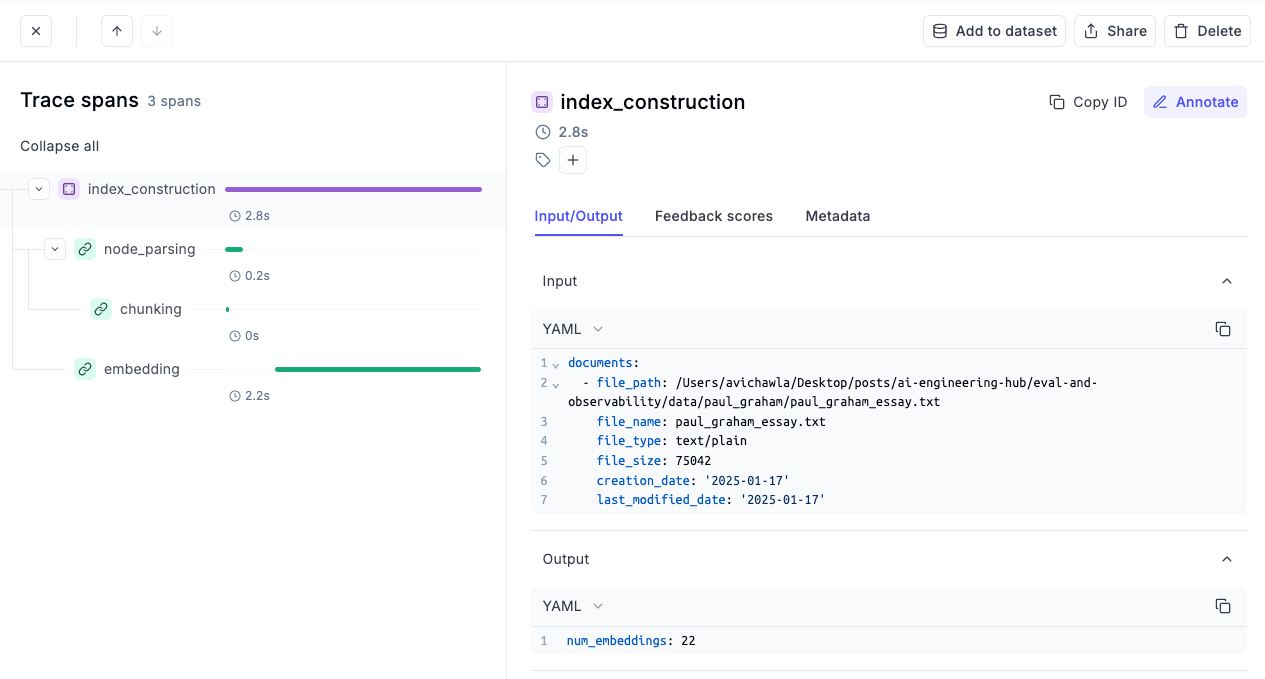
- First, we have an index construction process, which we just ran when defining the RAG pipeline. Opening this specific trace shows everything that went into this process, like the data location, total embeddings, the time it took to embed and chunk the data, etc.
- Next, we have the step where we queried our vector database to produce a response, which highlights so many details about the LLM invocation, like the input, the output, the number of tokens used, the cost incurred for this specific run, the time spent in each process, and more:
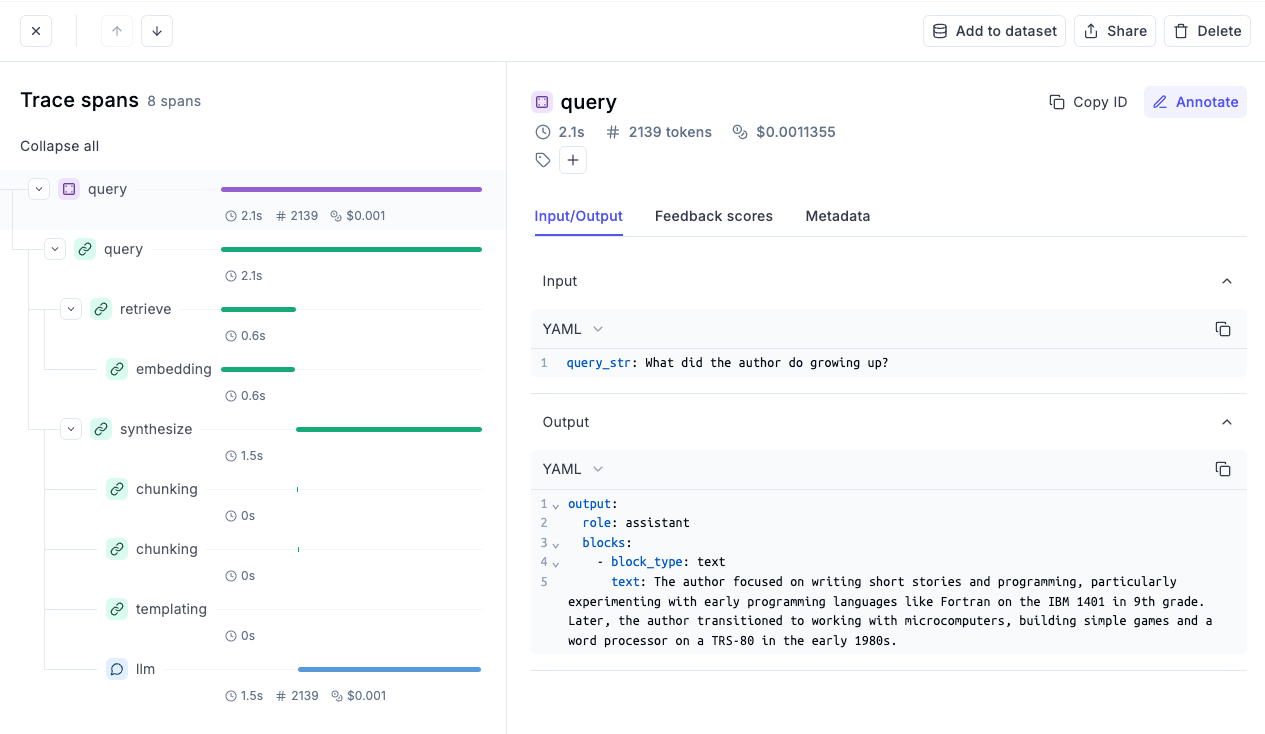
- Moreover, if we look at the retrieve trace, it tells us all the retrieved context, which can be easily inspected the retrieved context for better debugging:
- Similarly, we can look at the subprocess, like the final prompt, the generation process, etc.
RAG evaluation and tracking with Opik
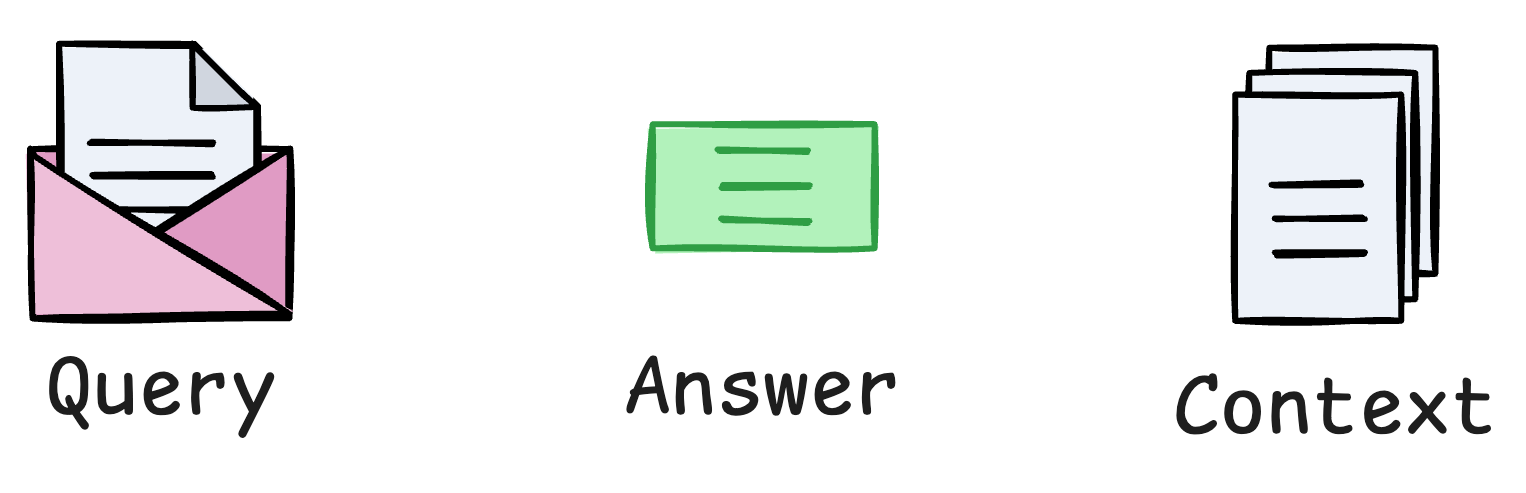
Now that we have a RAG pipeline ready, it's time to create a data set on which we can evaluate it. In order to do this, we have created a sample data set that has a question, an answer, and the context that is being used to arrive at this answer.
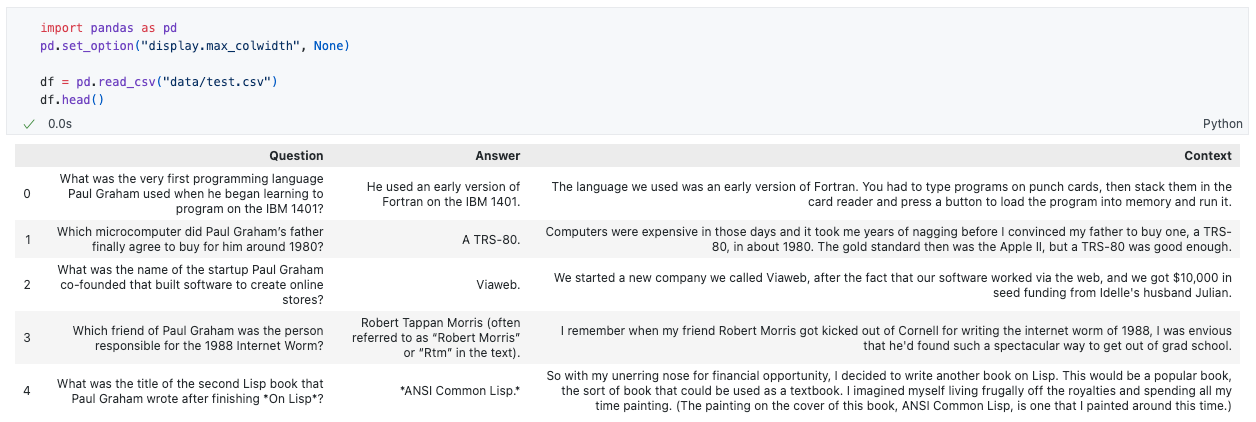
You can download this dataset below:
We have already learned how to generate this in Part 2 of our RAG crash course series so we are not going to discuss it again:
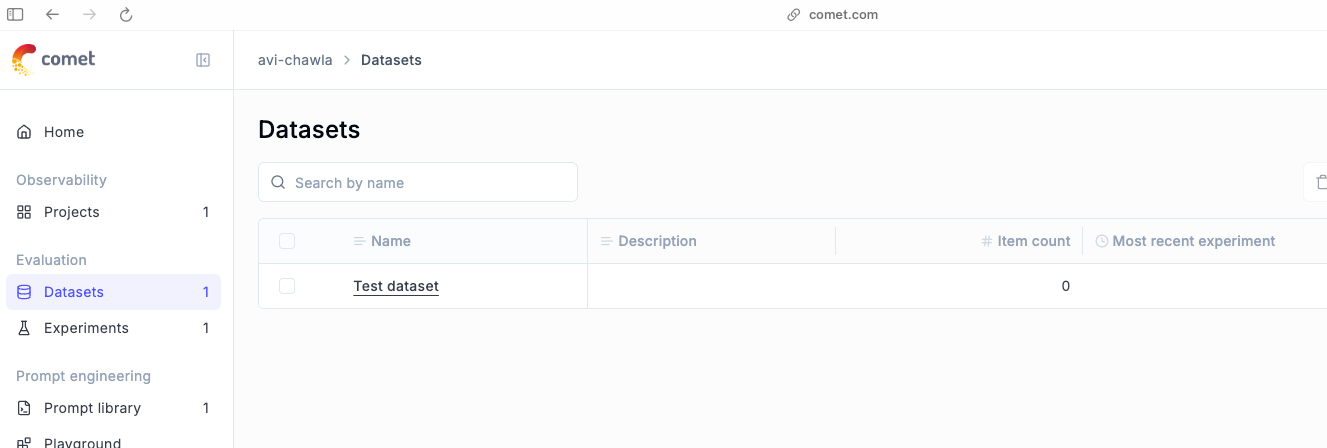
To get started, we first define a dataset client in Opik:
This immediately gets reflected in the datasets tab of the dashboard:
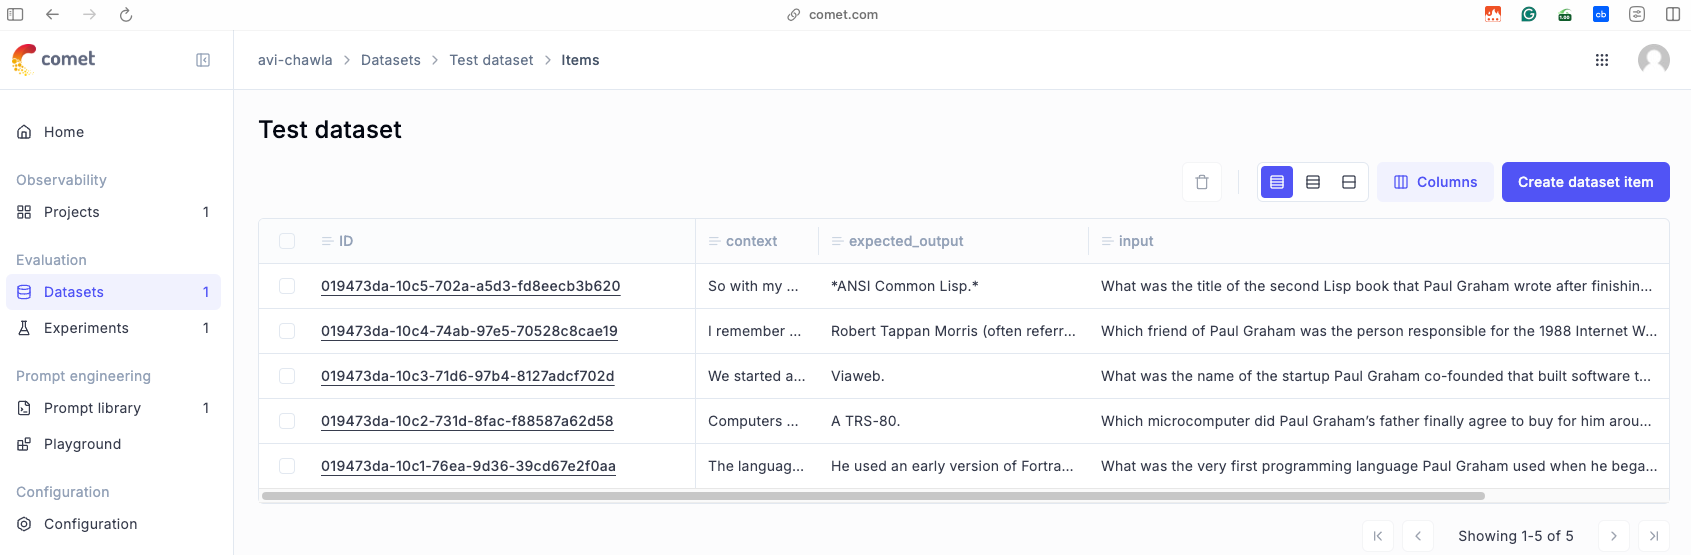
Now, we need to push our dataset to this dataset client.
To do this, we first create a dictionary of our question-answer-context triplets and upload it to our client using the insert method of the dataset object created above:
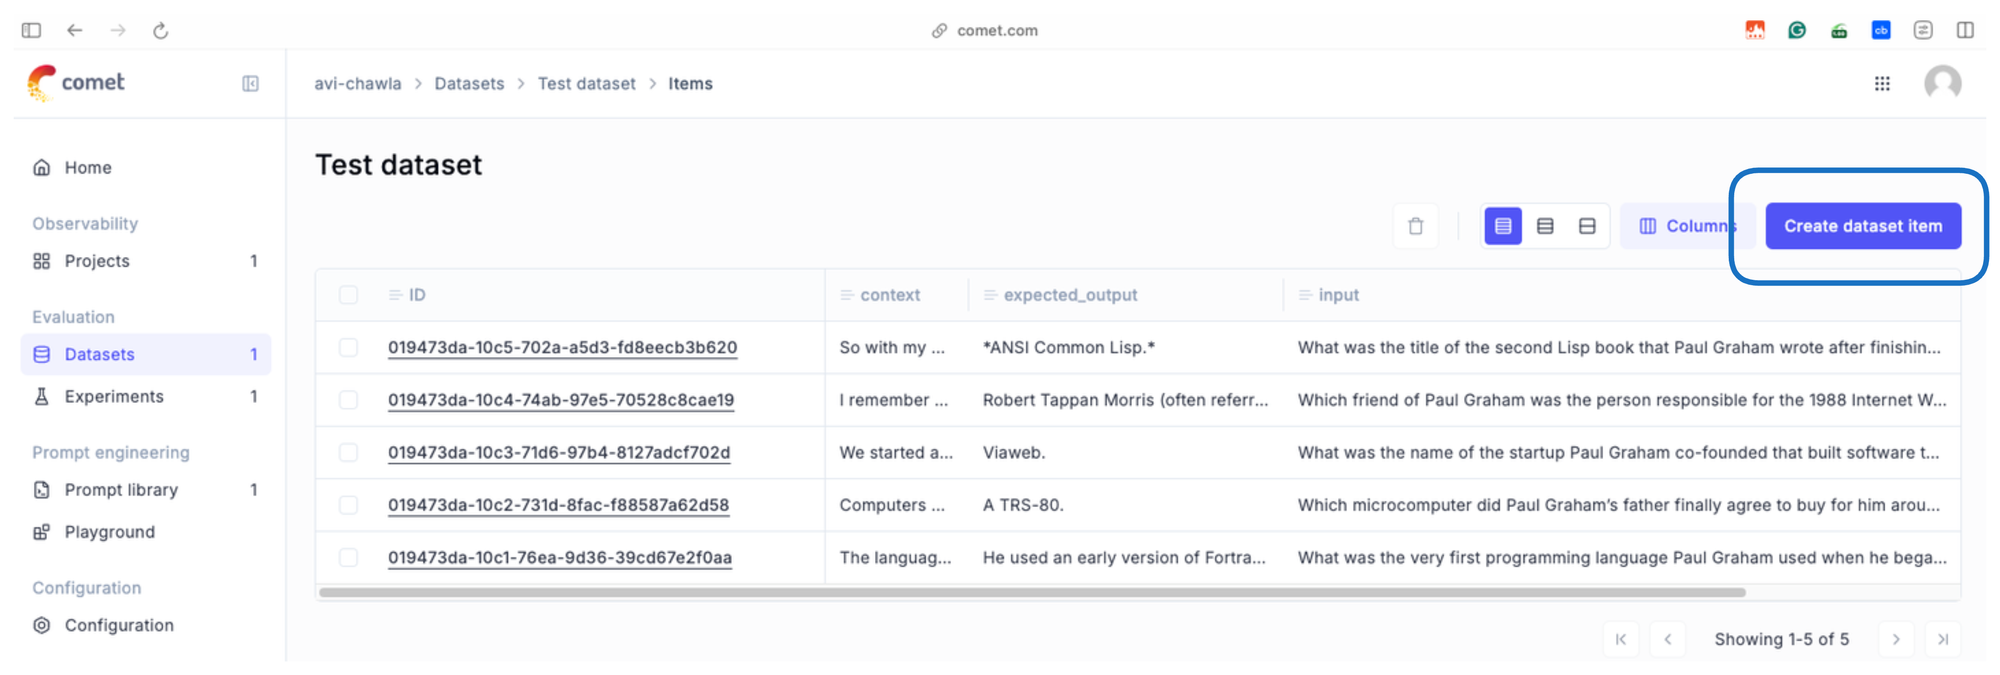
These records immediately get reflected within the dataset shown in the dashboard as shown below:
That said, you can also easily add a new data set item using the same format—the input, the expected out, put and any additional field that you want to add here.
For instance, say you have your application up and running in production and then you encounter a really interesting example that you want to be part of your evaluation set. So you can easily do that using the above code.
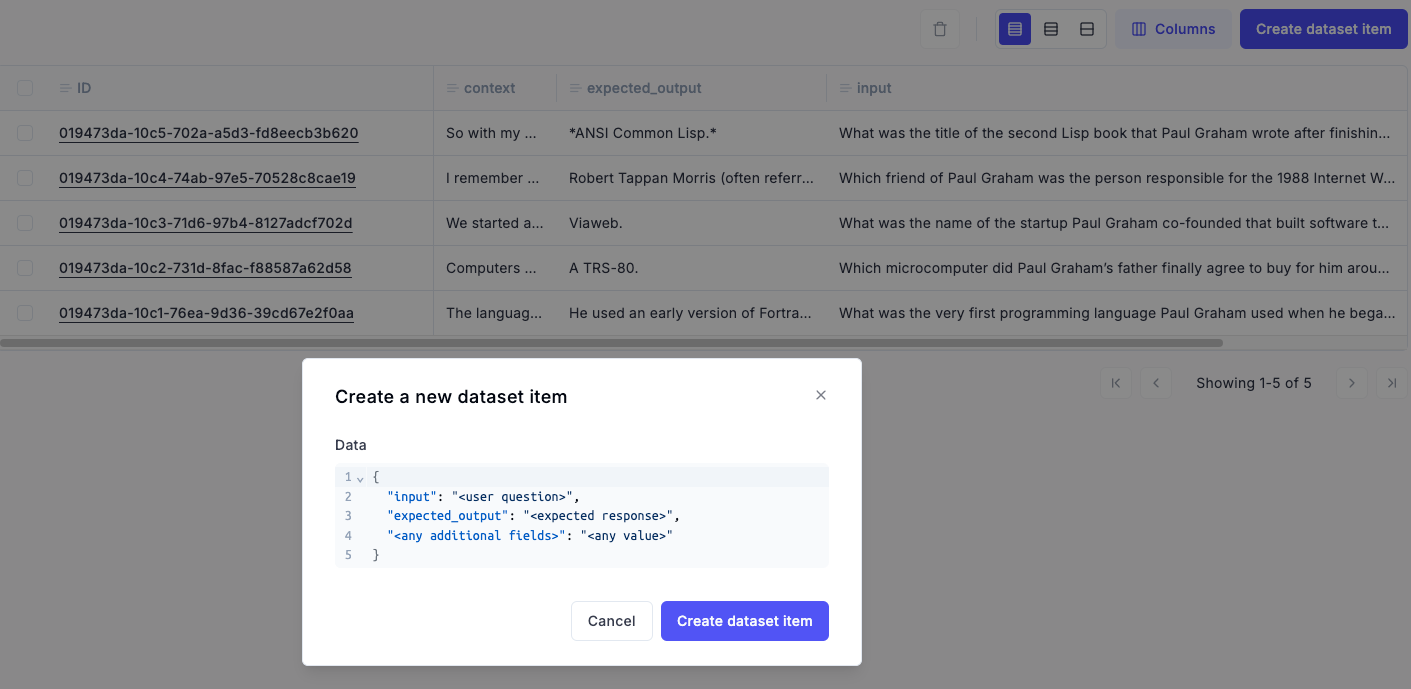
There's one more way.
- Click on “Create dataset item”:
- Next, you can populate these fields using the UI:
With that, we have everything ready to do an end-to-end evaluation, and it's time to put everything together and see how it works.
More specifically, we have already created a data set, and now we just need to create an evaluation task.
Inside that task, we are going to put the LLM application (which is our RAG app).
We shall also take all the expected output from the data set that we created to get feedback on how our application is working.
So the first thing we need to do is create an LLM application. This we have already seen above:
We start with the necessary imports:
Next, we do the following:
- We use the
SimpleDirectoryReaderfrom LlamaIndex to read all the documents from the directory created above during data download. - With the documents loaded, the
VectorStoreIndexis created to serve as the foundation for efficient retrieval. This index maps document content into a vector space stored in memory. - Once the index is ready, a query engine is created to perform semantic searches or answering specific questions based on the indexed data.
Done!
Next, we use the @track decorator we used earlier in this article to define a function:
Inside this function, we have our RAG application. It takes a user query, which is the input string, and provides a string output, which is the output of the RAG application.
This my_llm_application is our final application now, which, in your case, can be anything—RAG, multimodal RAG, Agentic RAG, etc.
Next, we are going to use the same OpenAI integration to track all the LLM calls:
After this, we need to create an evaluation task that specifies the output that you get for a particular input. And inside this, we need to put in our LLM application:
After this, we create a data set client, which we already saw above:
The next part is to define all the evaluation metrics based on which we will evaluate our LLM application.
So we instantiate some evaluation metrics to evaluate our pipeline with as follows:
Based on the expected output and the output given by our application, we will get feedback scores for our LLM application.
Once this is done, it's time to run the evaluation, and we are going to put everything together—the data set, the evaluation task, the scoring metrics, all four metrics that we just discussed here, and the experiment configuration wherein we specify the model we intend to us as our evaluation system which acts as a judge and see like how things are working.
This is implemented below:
Done!
This produces the evaluation results shown below:
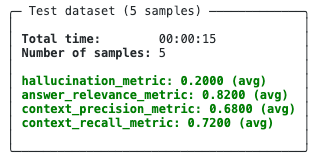
More specifically, these are the average scores we got for each of the four metrics on the five examples in our evaluation dataset.
We can also view these results in the Opik dashboard under the "Experiments" section:
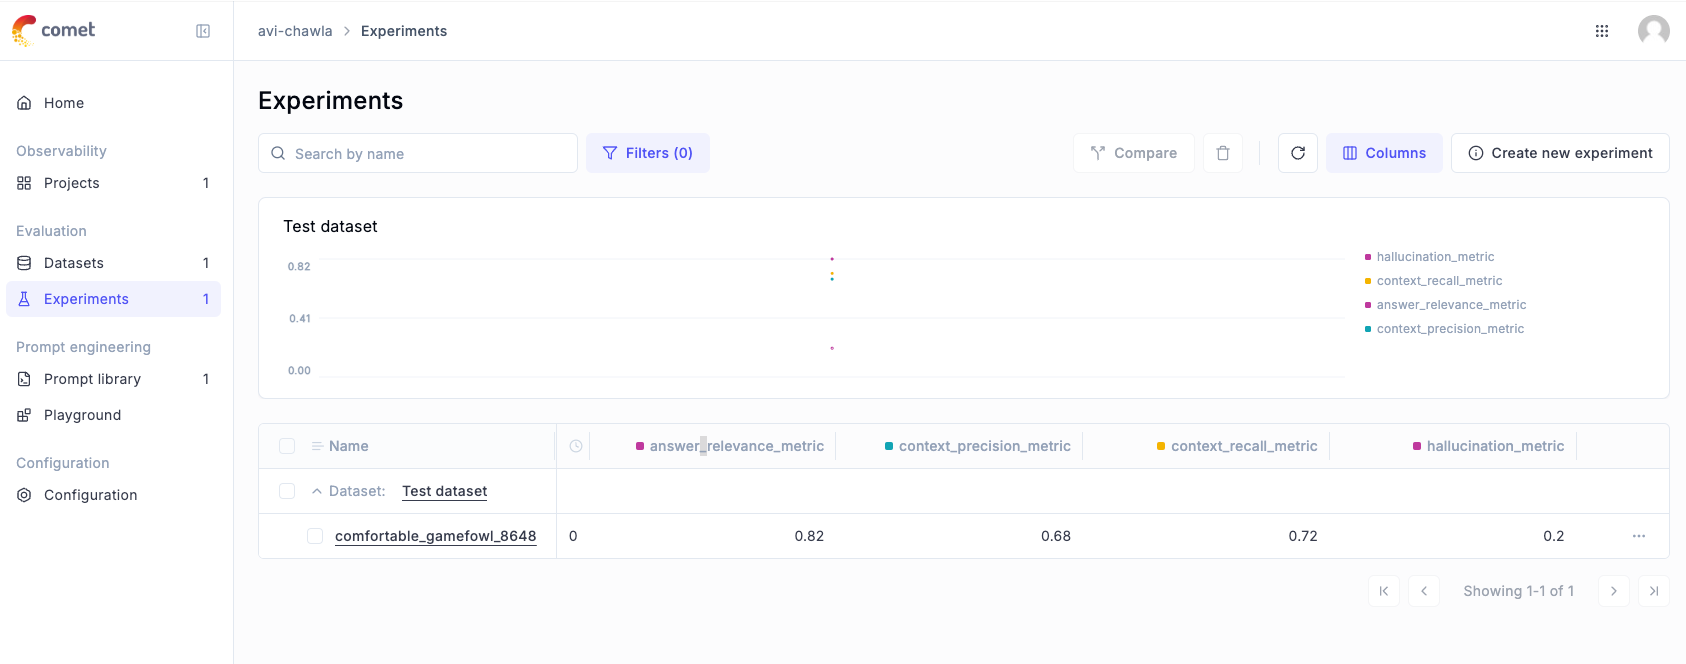
Let's select our evaluation:
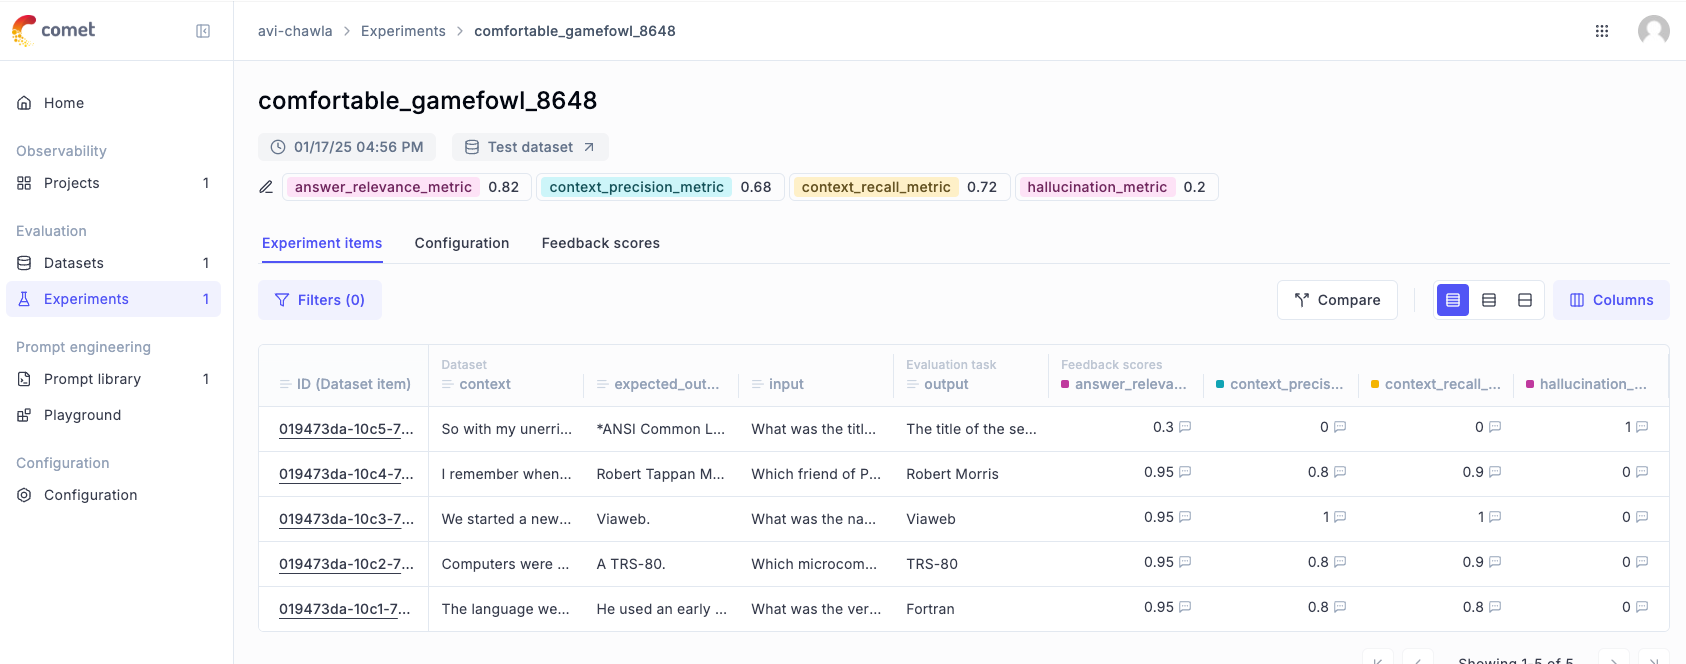
And here, we can see the individual scores for each of the 5 test samples we had in our evaluation dataset.
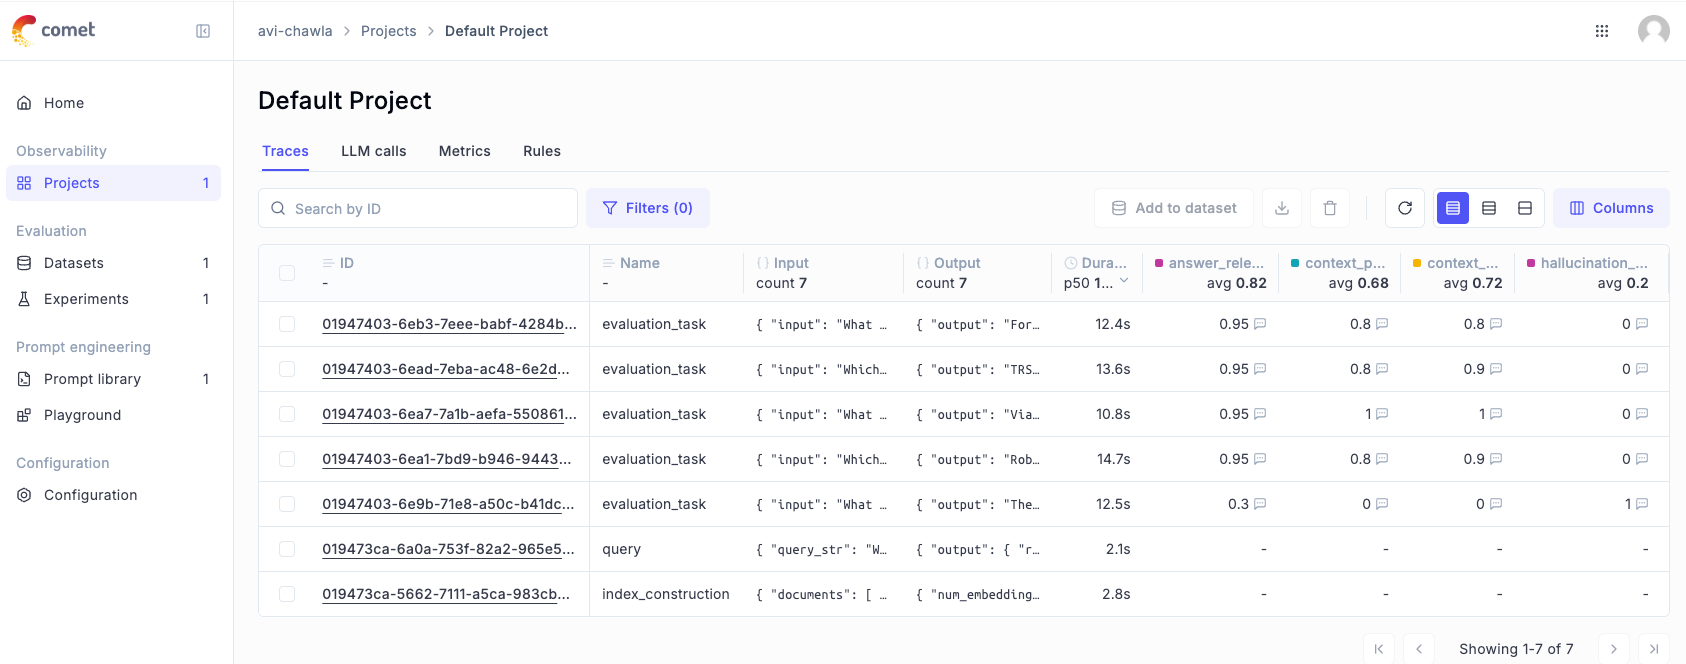
Moreover, if you go to the "Projects tab" and select your project, you can see all evaluation task-related activities:
If we open the very last evaluation task (which has a hallucination score of 1), it gives me a detailed overview of everything that happened for this specific example:
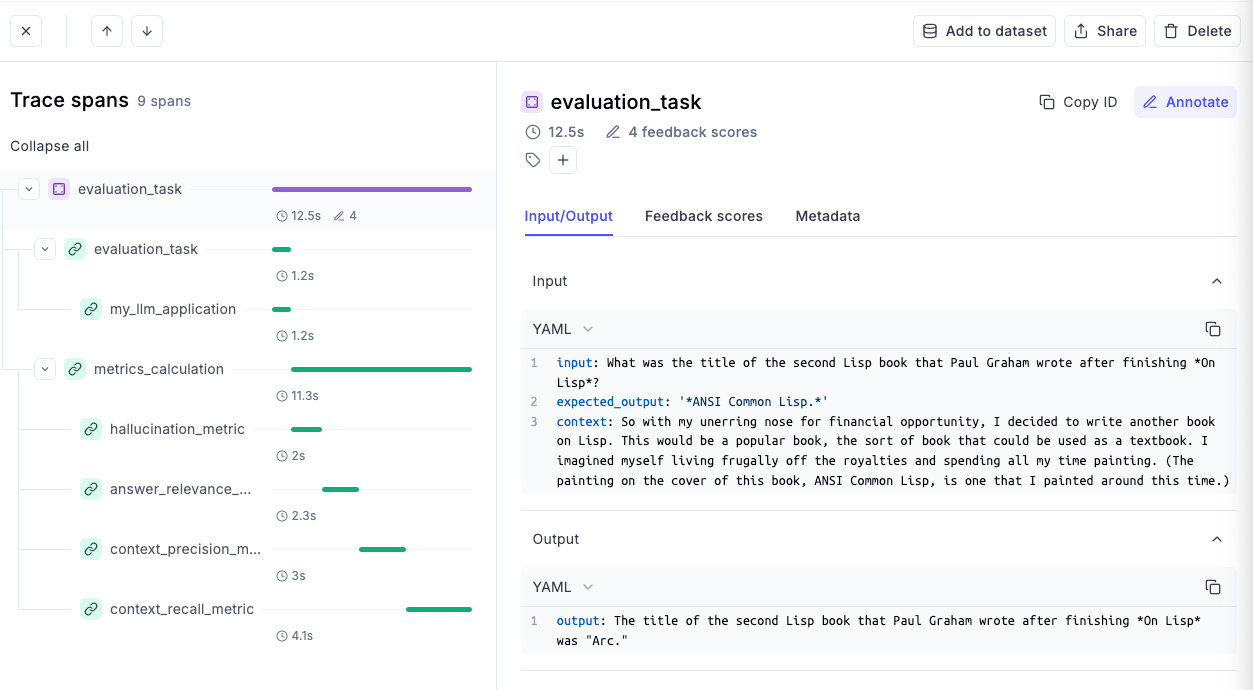
This includes the inputs of the dataset we had in this first item, the output that was produced by our LLM pipeline, the time taken to compute each of the evaluation metrics and much more.
Let's say you want to go into more details related to the hallucination of this evaluation example, we can select the "hallucination_metric" section to see the input, the output and the corresponding context it retrieved. Moreover, as shown below, it also shows a reason behind producing a particular score.
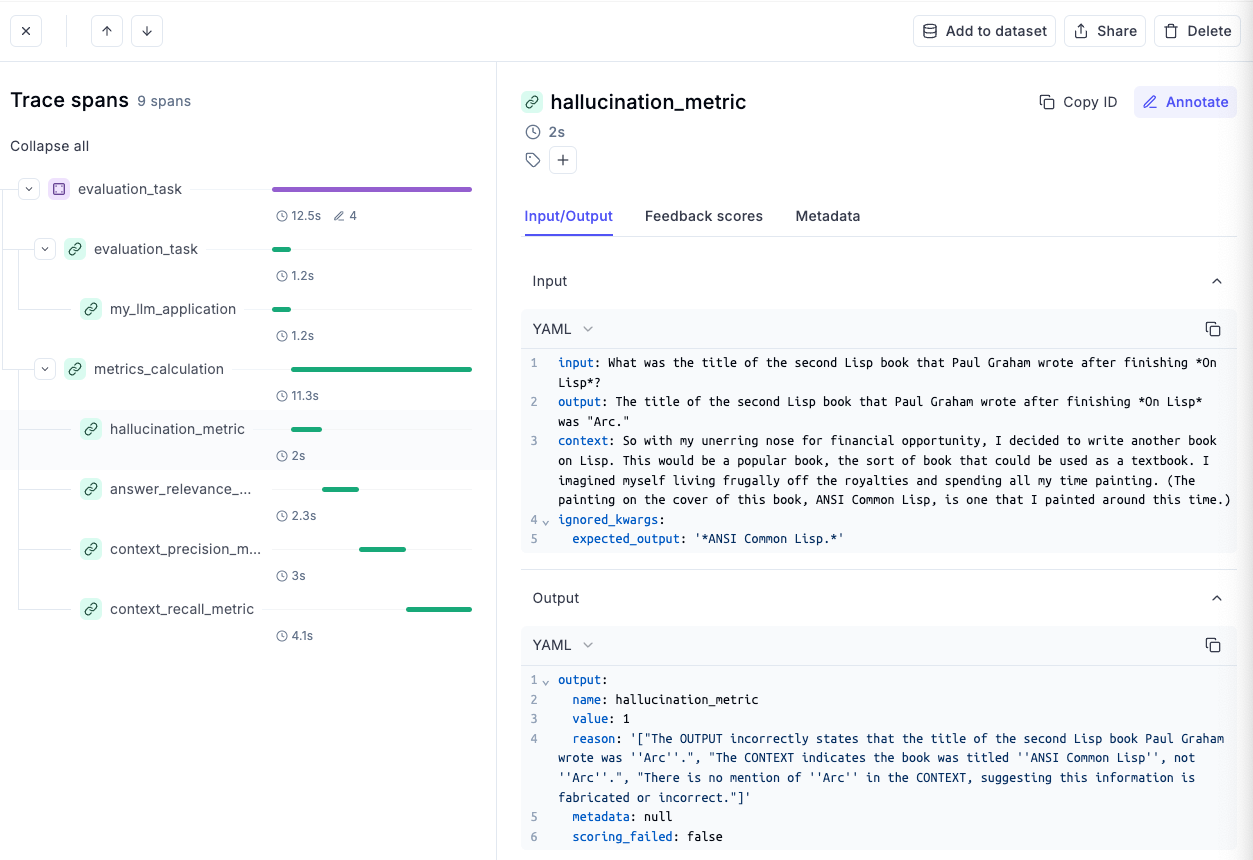
This makes it much easier to debug and understand what's happening and how you can make further improvements to your system.
Conclusion
With that, we come to an end of this deep dive on LLM evaluation and tracking using a relatively new but extremely powerful open-source framework—Opik.
As we saw above, each of the underlying technicalities for evaluation and tracking has already been implemented by Opik, so the only thing you are supposed to do is build your LLM apps.
Every aspect of evaluation and tracking is handled by Opik.
Moreover, in this demo, we only looked at OpenAI and Ollama, but all the supported integrations and how to use them in your projects are available in the quickstart guide.
In most cases, you would hardly have to add a few lines of code to your existing pipelines to have this robust framework integrated into your LLM applications.
The code for today's article is available here:

As always, thanks for reading!
Any questions?
Feel free to post them in the comments.
Or
If you wish to connect privately, feel free to initiate a chat here: