Introduction
If you look at the search trends for "model interpretability," it’s clear that it hasn't always been a priority for machine learning practitioners.

For a long time, interpretability was a concern primarily limited to academia, where researchers would try to explain WHY their models perform better than other models in their research papers, or niche industries like finance, where regulations and transparency were essential.
Most machine learning practitioners, however, were content with treating models as black boxes as long as they delivered accurate predictions.
However, in recent years, the demand for transparency in machine learning models has surged.
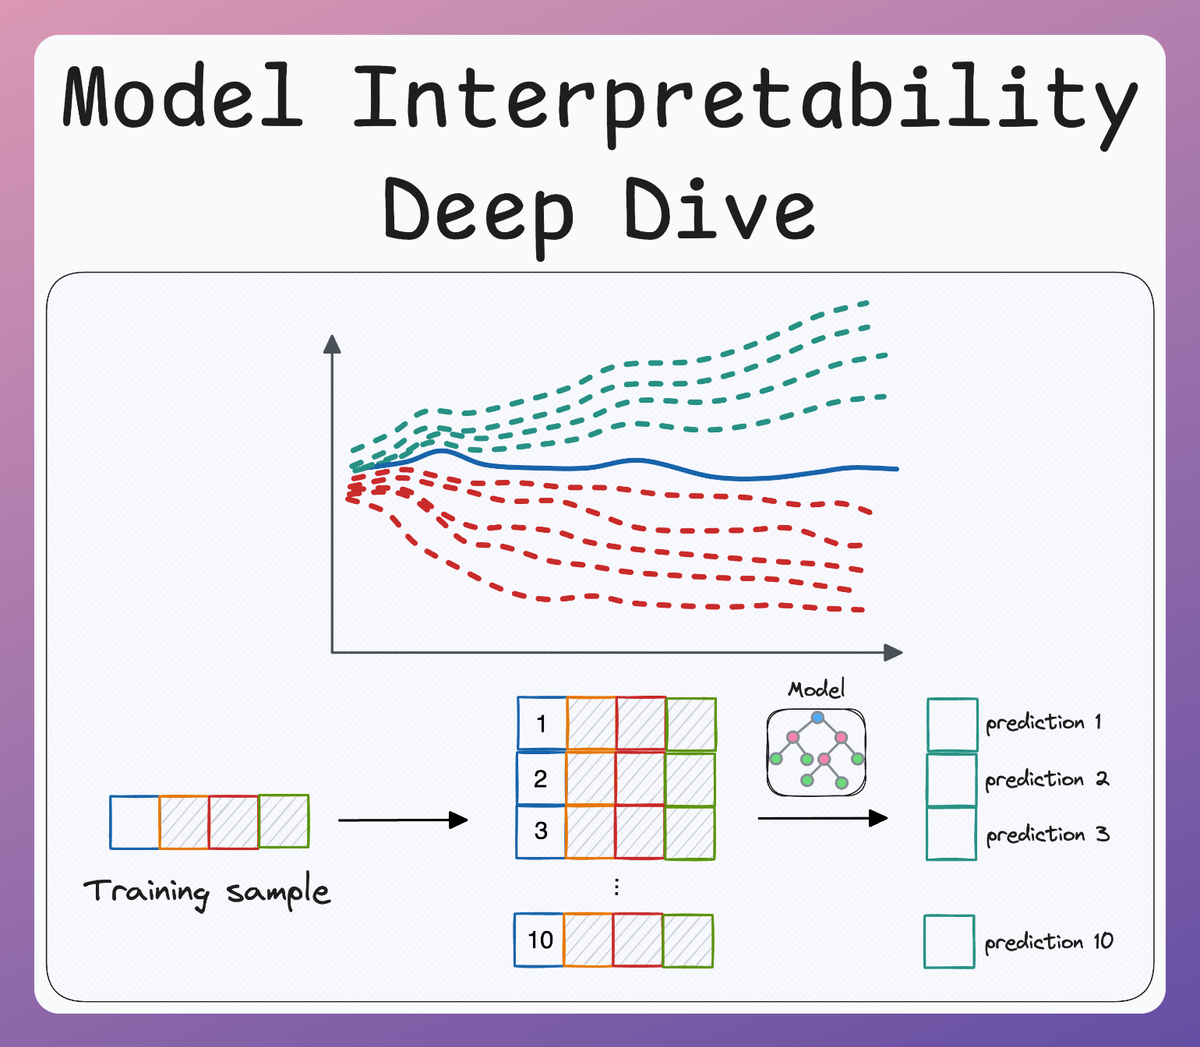
A significant inflection point can be observed around the time Transformer models were introduced in 2017 (shown in the figure above).
Here, I’m not suggesting that everyone was immediately trying to interpret Transformer models.
Instead, the post-Transformer era marked a turning point when several organizational leaders got much more serious about their business’ AI strategy.
While they were already solving business use cases with ML, since the applicability of ML grew across several downstream applications, the risks grew equally.
At this stage, it was realized that machine learning couldn’t simply be about producing predictions—it also needed to be about trust and transparency.
In the first part of this crash course, we went into quite a lot of detail about some model interpretability methods and how Partial Dependence Plots (PDPs) and Individual Conditional Expectation (ICE) help us investigate the predictions of a machine learning model:

This part extends the ideas we discussed in Part 1 to cover more interpretability methods, specifically LIME.
Like Part 1, let's dive into the technical details of how it works internally, and how to interpret it (while ensuring that they don't mislead you).
Let's begin!
LIME
Introduction
Consider the PDPs and ICE plots shown below which we discussed in Part 1.

These are some insights we got from these plots:
- PDP for Feature 0 shows a clear upward trend. This suggests that feature 0 has a strong positive influence on the model’s predictions.
- Similar to feature 0, the PDP for feature 1 also shows an upward trend, suggesting that higher values of feature 1 result in higher predicted outcomes.
- The PDP for feature 2 is relatively flat, indicating that this feature has little to no effect on the model’s predictions.
- Feature 3 has a slight upward trend, meaning it has a small but positive effect on the predicted outcome.
- The PDP for feature 4 exhibits a modest upward trend, implying that this feature has a positive influence on the predictions, though the effect is not as strong as for features 0 and 1.
Now, if you think about it, these insights depict the holistic behavior of the model, i.e., when we consider it over a border range of feature value so that we can understand the trend of this model.
In other words, this does not tell anything about what's happening locally at a prediction level.
LIME is different.
Unlike traditional methods that produce insights into the overall trend of the model, LIME takes a local approach, so we get to have interpretable explanations for individual predictions.
This allows us to explain why a particular prediction was made, in contrast to global trends.
This concept is well-reflected in the name Local Interpretable Model-agnostic Explanations (LIME):
- Local:
- Focuses on explaining individual predictions by examining the model's behavior in a localized region around the data point of interest.
- Interpretable:
- Provides clear, human-readable explanations that are easy to understand, such as feature importance scores.
- Model-agnostic:
- Works with any machine learning model, regardless of its complexity or structure.
- Explanations:
- Offers specific reasons for why a particular prediction was made.
Interesting, isn't it?
Frankly speaking, since LIME, there have been some more advancements in this space, which means LIME isn't as popular as it used to be once (this does not mean it isn't relevant now).
Despite that, it is worth understanding the underlying ideas due to two reasons:
- It follows a simple and intuitive approach that still works for several interpretability problems.
- More complex methods like SHAP take inspiration from LIME to develop a more robust framework for local interpretability methods. Since we intend to discuss these methods too soon, it would be good to know the background details.
I believe that a large part of building interpretable models boils down to having a deep understanding of the interpretability methods themselves.
These approaches are unlike skills that go into model training using sklearn, for instance, since you can still train a model without necessarily knowing all the internal details (although this is not something I recommend).
Interpretability methods are different. They demand a deeper understanding of both the model and the data because you're not just building a model—you’re explaining it. These methods require you to actively engage with the inner workings of the model to uncover how decisions are being made, and this process is often non-trivial.
In other words, unlike simple model training, where you can use tools without necessarily understanding the underlying mechanics, interpretability methods force you to think critically about feature importance, interactions, and local behavior.
In essence, these methods go beyond simply building models; they involve crafting narratives around the model’s predictions to make them comprehensible and justifiable.
How it works?
Now that we understand the motivation, let's dive into the technical details of how LIME works.
At its core, LIME is grounded in a clever and insightful observation. To illustrate this, let’s refer to the following plot, which I previously used to explain why ReLU functions are considered non-linear activation functions:

Here, consider the plot with 25 ReLU units:
Read the full article
Sign up now to read the full article and get access to all articles for paying subscribers only.
Join today!


