Optimize Your ML Development and Operations with MLflow
The guide that every data scientist must read to manage ML experiments like a pro.
Motivation
In my experience, most ML projects lack a dedicated experimentation management/tracking system.
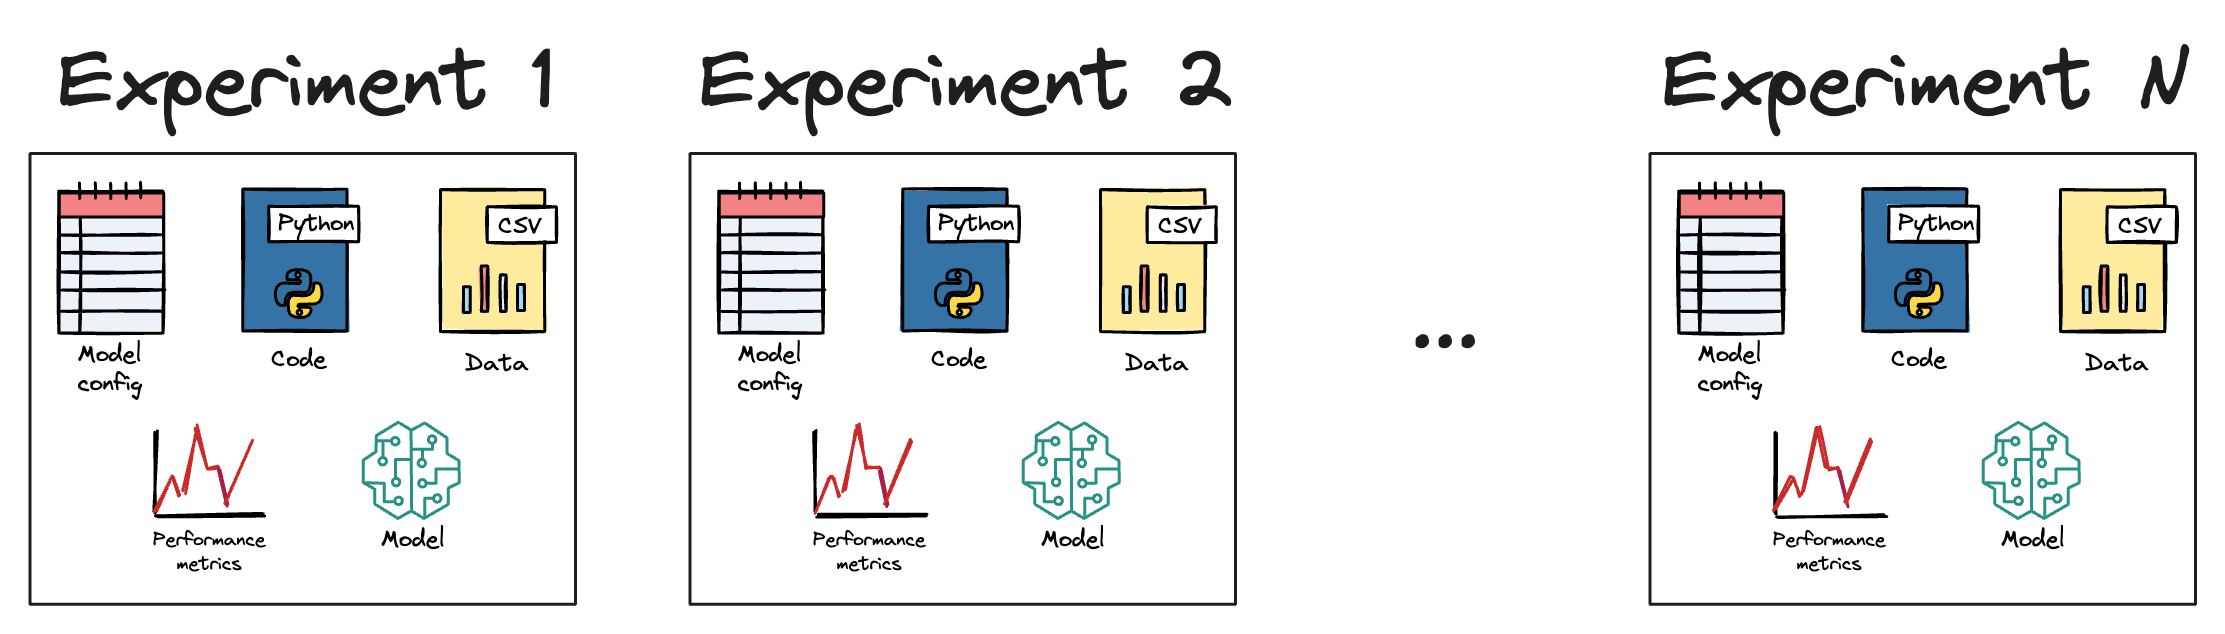
As the name suggests, this helps us track:
- Model configuration → critical for reproducibility.
- Model performance → critical for comparing different models.
…across all experiments.
Most data scientists and machine learning engineers develop entire models in Jupyter notebooks without having any well-defined and automated reproducibility and performance tracking protocols.
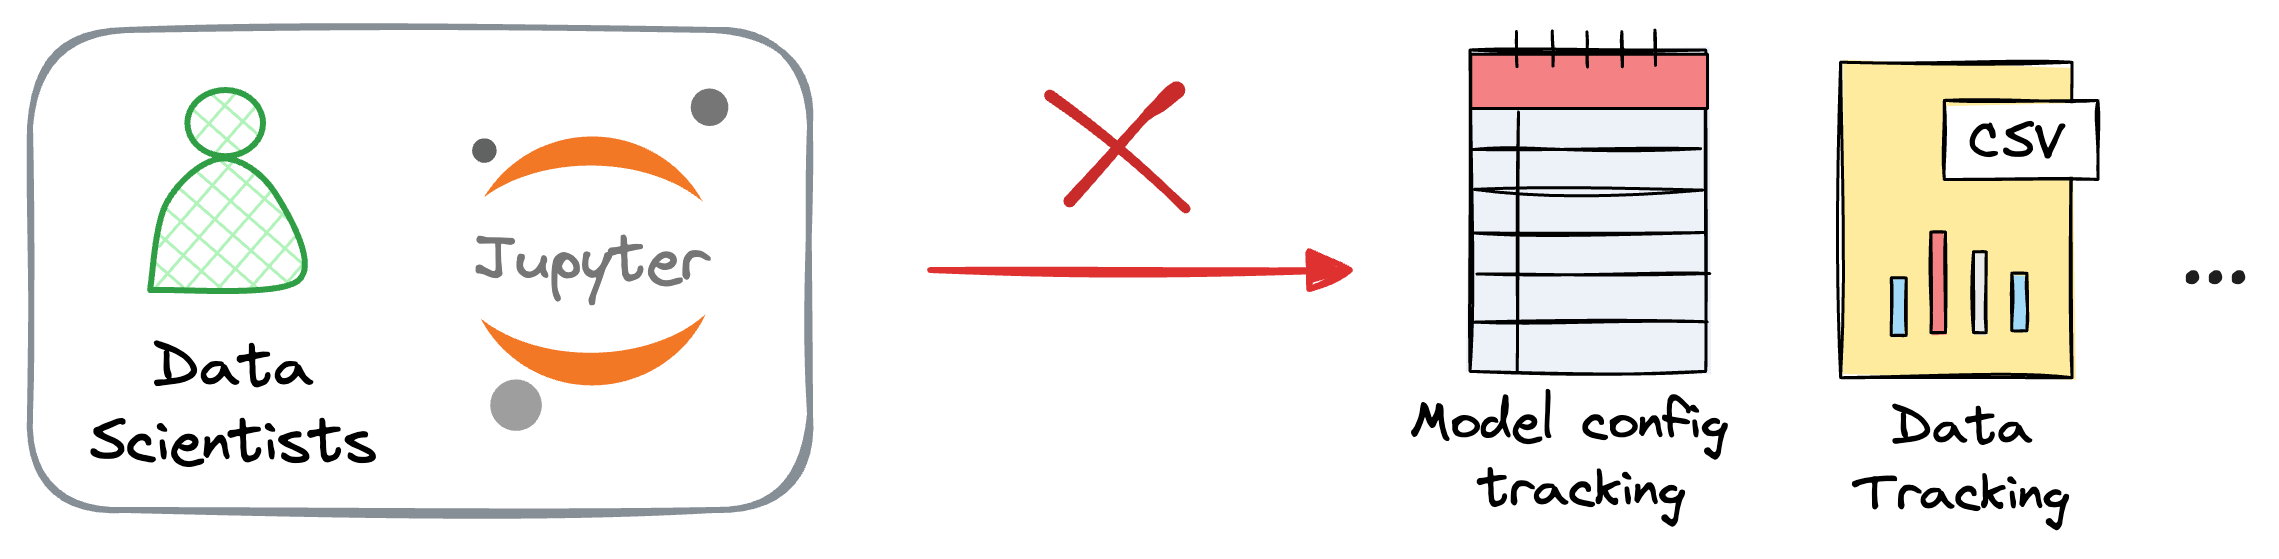
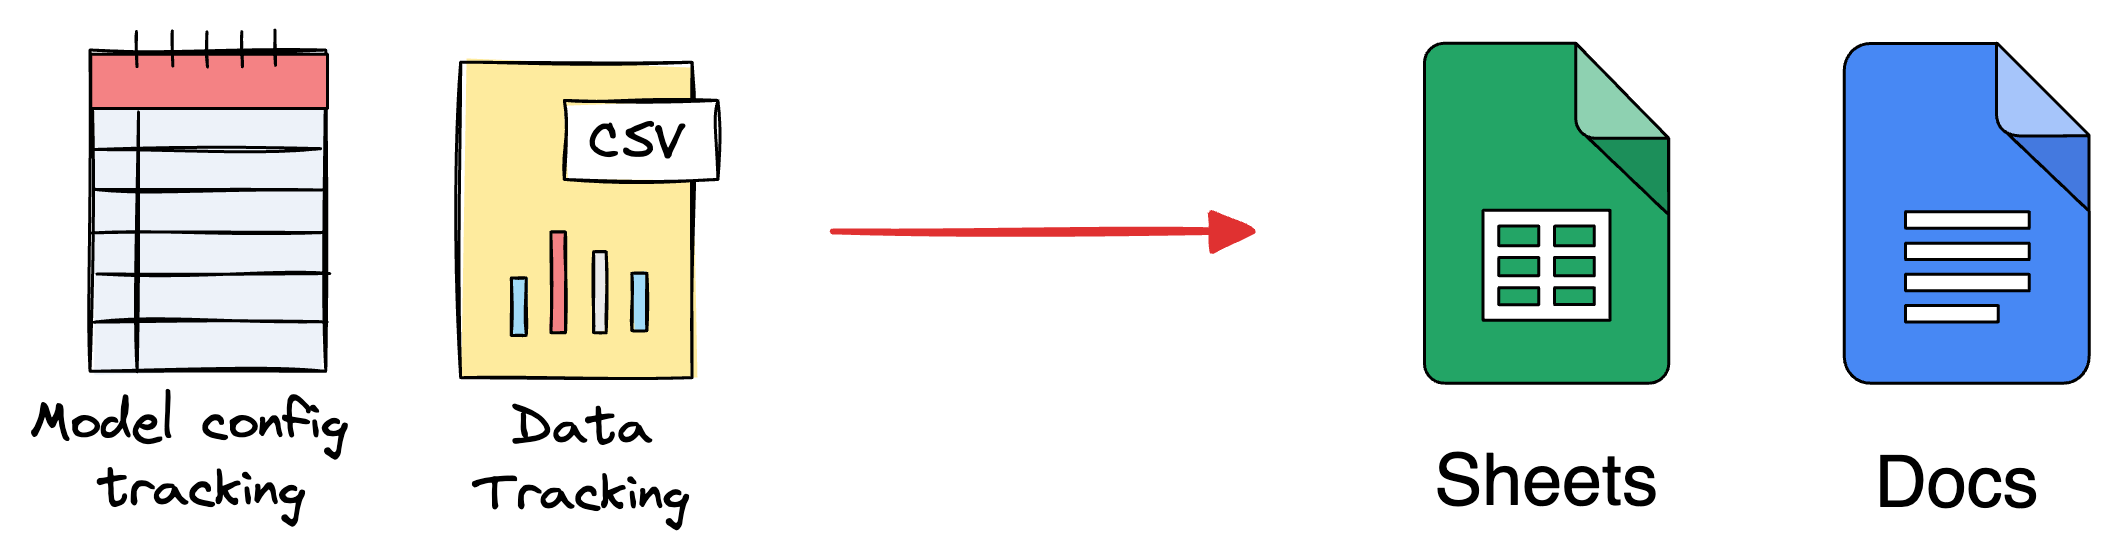
They heavily rely on inefficient and manual tracking systems — Sheets, Docs, etc., which get difficult to manage quickly.
MLflow stands out as a valuable tool for ML engineers, offering robust practices for ML pipelines.

It seamlessly integrates with various cloud services, which facilitates flexibility in usage — whether locally for an individual or remotely for a large ML engineering team.
This deep dive is a complete walkthrough guide on understanding how we can integrate MLflow in our existing machine learning projects, which lets us automate many redundant and manual tasks.
Let’s begin!
Traditional ML challenges
Before getting into the technical details, it’s pretty important to get into more details about understanding the motivation for using MLflow.
Thus, let’s spend some more time learning about the challenges with existing approaches, which are mostly manual.
#1) Improper Version Control Practices
One of the significant challenges in traditional ML modeling is the absence of proper version control practices.
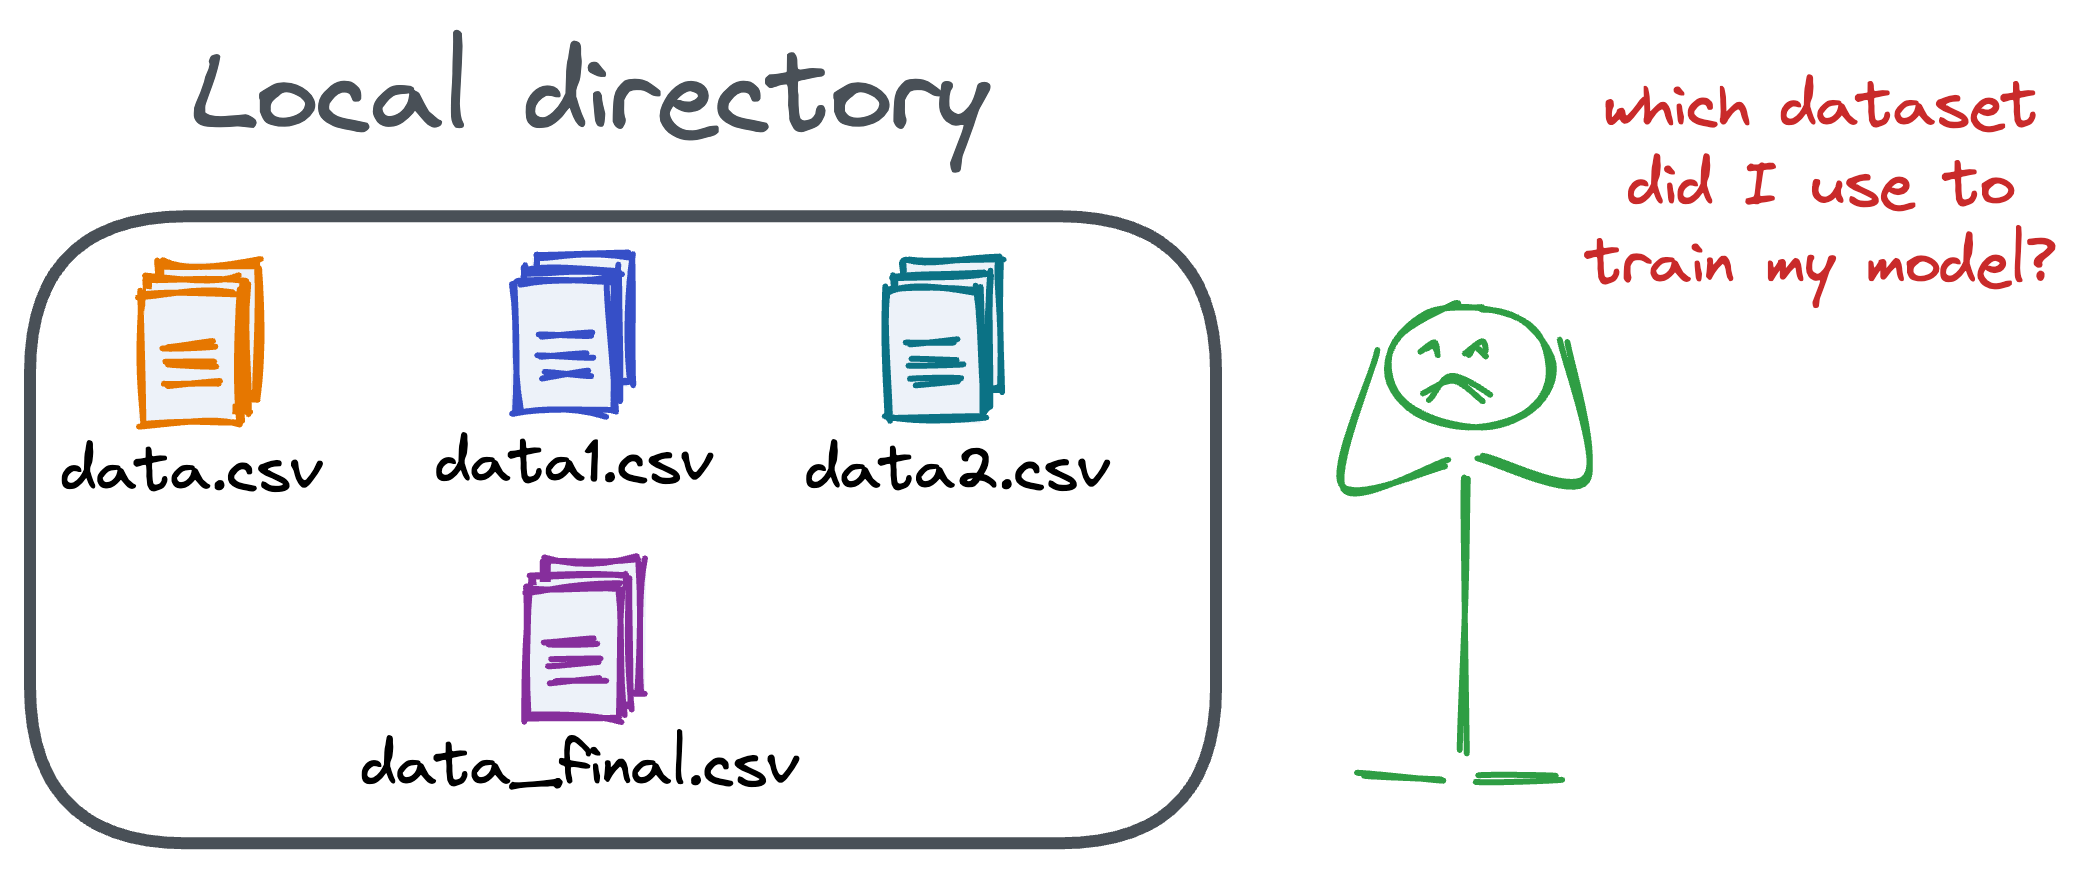
Many ML practitioners struggle with managing different versions of their models, code, and data, leading to potential issues such as difficulty in reproducing results, tracking changes over time, and ensuring consistency across the development lifecycle.
#2) Manual Parameter and Data Tracking
In conventional ML workflows, tracking and managing parameters and data manually pose significant challenges. This manual process is error-prone, time-consuming, and lacks traceability.
ML practitioners often resort to spreadsheets or documents to record parameter configurations and data sources.
However, this approach not only hinders efficiency but also makes it challenging to maintain a comprehensive record of experiments, hindering the ability to reproduce and validate results.
#3) Collaboration Bottlenecks
Collaboration in traditional ML environments often faces bottlenecks due to the lack of centralized tools and standardized practices.
Team members mostly work in isolation and find it cumbersome to share models, experiments, and findings efficiently.
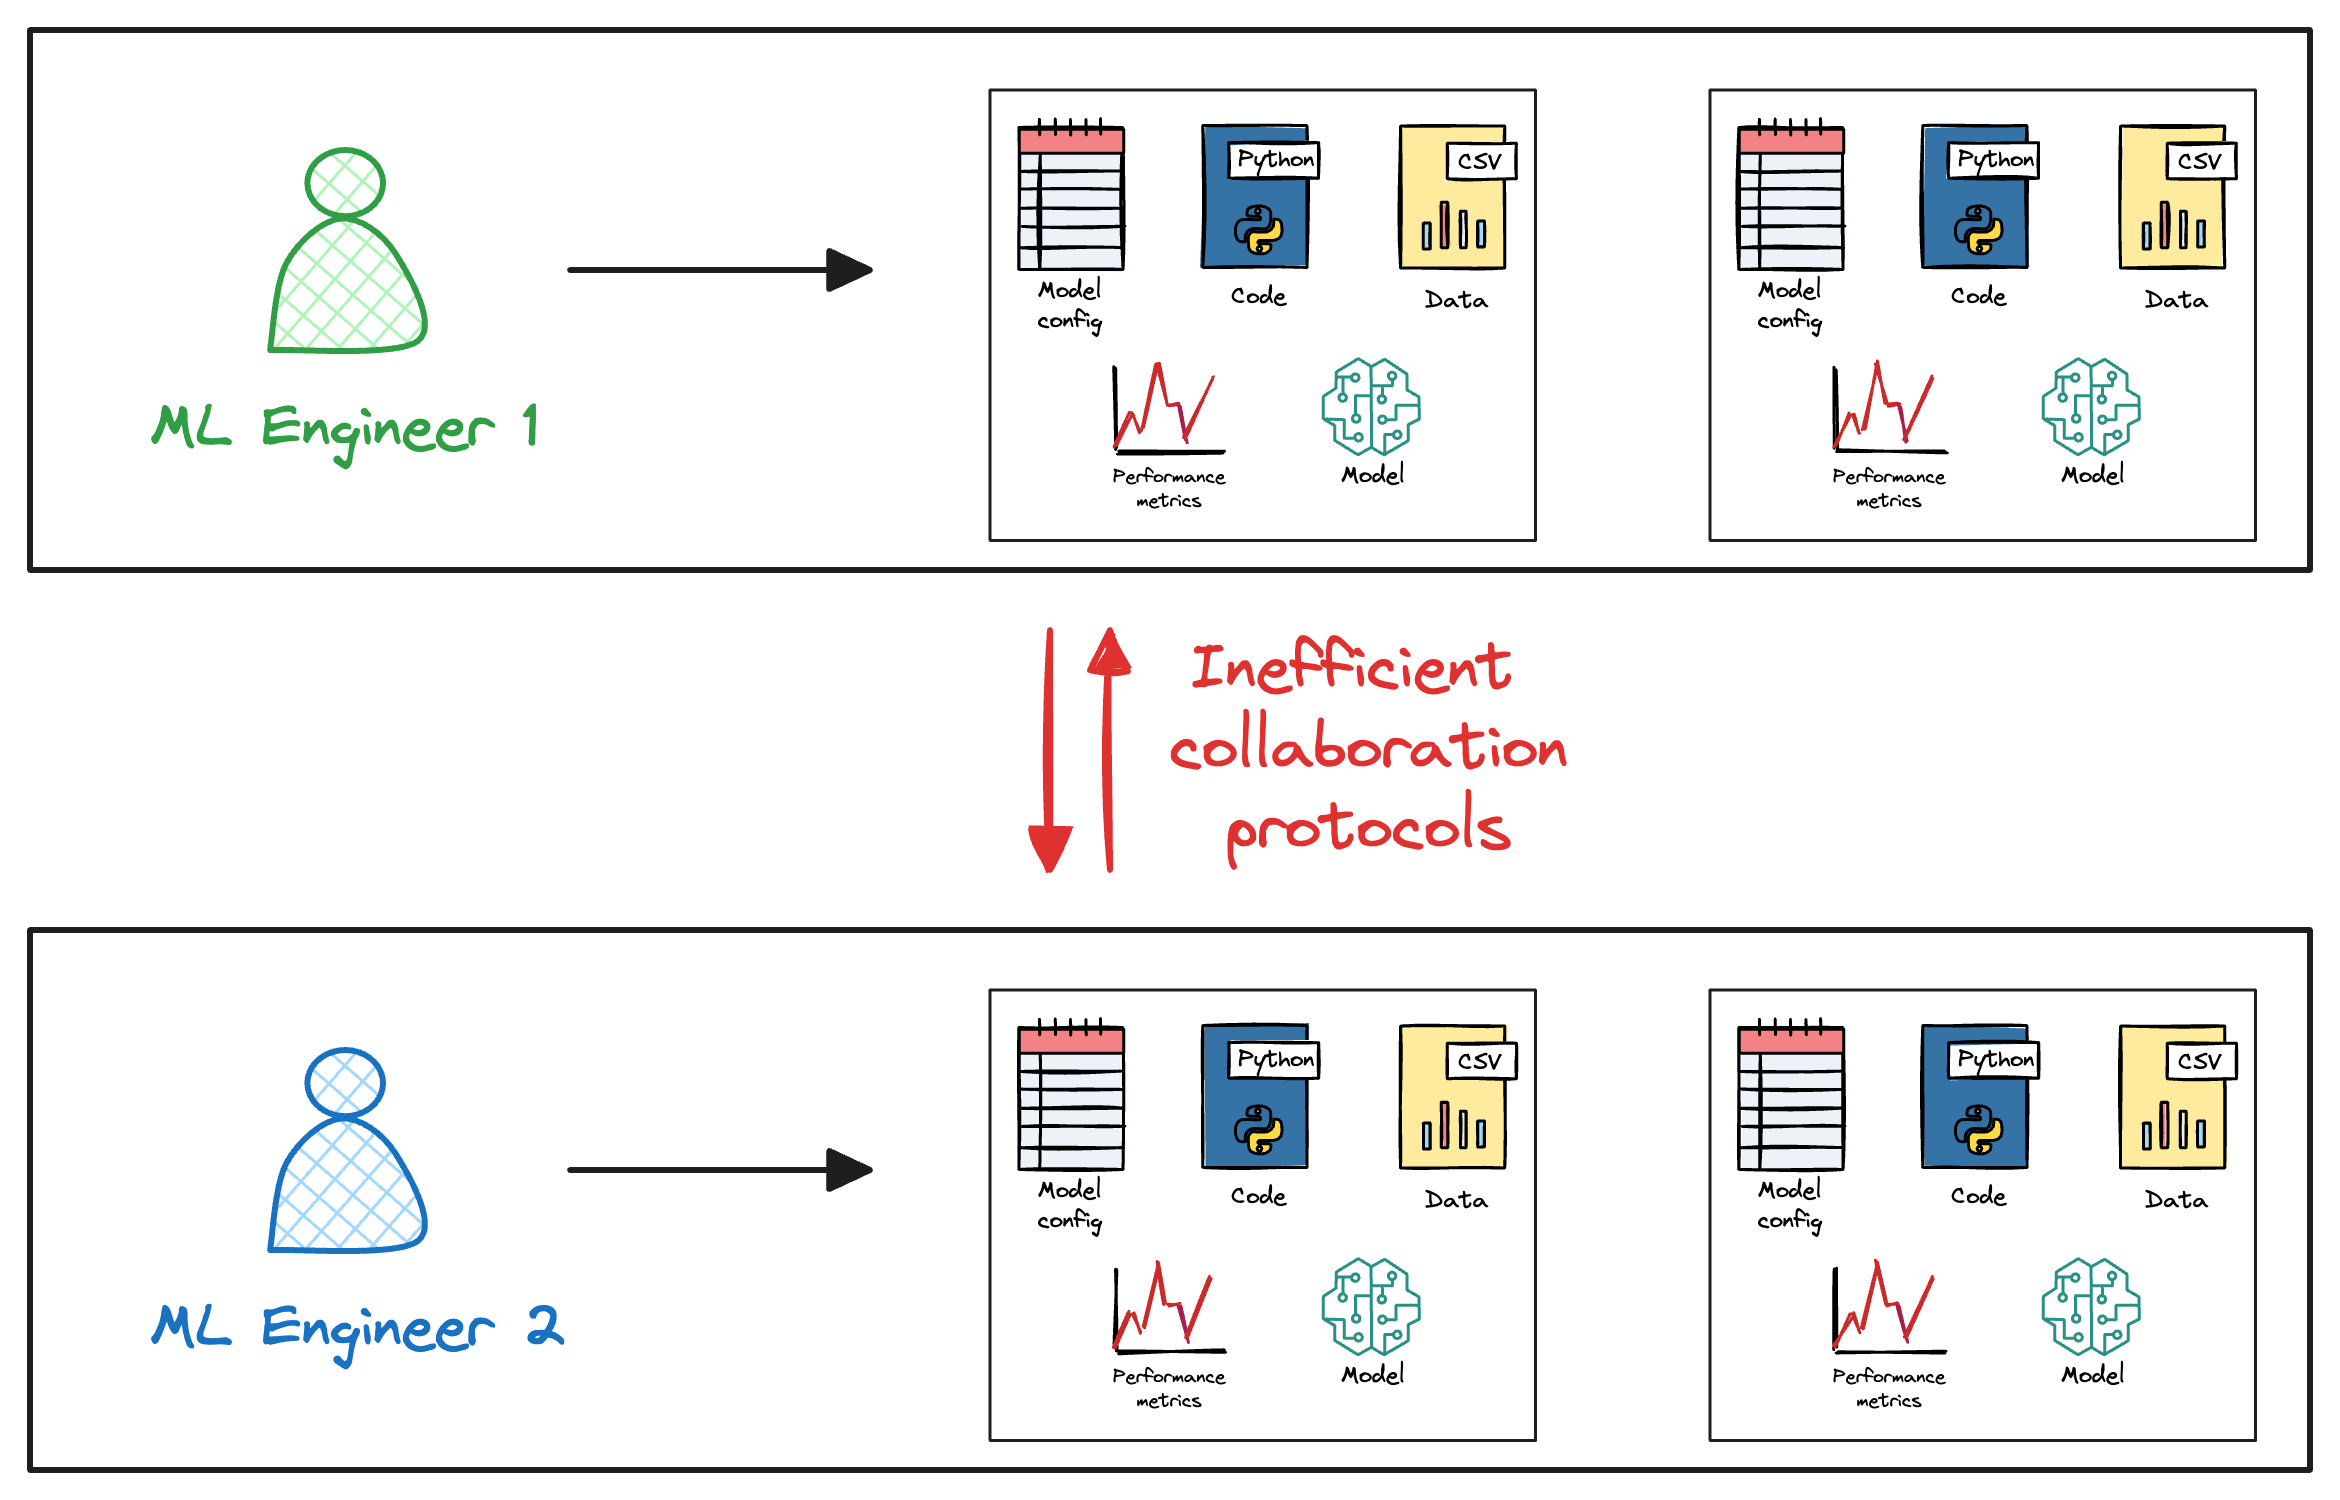
This lack of a unified platform for collaboration leads to siloed efforts, with each team member operating independently.
The absence of a streamlined collaboration process impedes knowledge sharing, slows down development cycles, and hinders the collective progress of the team.
Beyond version control, manual tracking, and collaboration bottlenecks, traditional ML modeling encounters various other challenges.
Inconsistent deployment processes, scalability issues, and the lack of standardized project structures contribute to the complexity of ML development.
Addressing these challenges is crucial for establishing efficient, scalable, and reproducible machine learning workflows, a topic we will explore further in the subsequent sections of this deep dive.
Getting started with MLflow
By now, I hope you would have understood the profound challenges in developing machine learning models:
- Version controlling data, code, and models is difficult.
- Tracking experiment configuration is quite challenging and manual.
- Effectively collaborating with team members and sharing results is tedious.
These challenges can be elegantly taken care of with standard MLOps practices. These help us build, train, deploy, and even automate various stages in our machine learning projects, without much intervention.
One of the best tools in this respect is MLflow, which is entirely open-source.
As we will see ahead, MLflow provides plenty of functionalities that help machine learning teams effortlessly manage the end-to-end ML project lifecycle.
Being end-to-end means it includes everything we need to:
- Track experimentations
- Share code/model/data
- Reproduce results
- Deploy models
- Monitor performance
- Schedule updates, and more.
MLflow components
As of 24th Jan 2023, MLflow offers several key components.
1) MLflow Tracking for tracking experiments (code, data, model config, and results) and comparing them for model selection.
2) MLflow Projects for packaging code used in data science projects in a format that makes them reproducible on any platform.
3) MLflow Models for deploying machine learning models built in various libraries to diverse serving environments.
4) MLflow Models Registry for creating a dedicated system to manage, organize, version, and track ML models and their associated metadata.
As we will learn ahead, each of these components is specifically designed to solve a particular problem in a machine learning project lifecycle, which we also learned earlier.
Other than these two, MLflow recently added two more components:
5) MLflow Deployments for LLMs for streamlining the usage and management of various large language model (LLM) providers, such as OpenAI and Anthropic.
6) MLflow LLM Evaluate for evaluating LLMs and the prompts.
Don’t worry if you don’t understand them yet. We shall discuss them in detail in the upcoming sections.
Install MLflow
MLflow is available on PyPI and can be installed as follows:
Done!
Now, we can move to learning about the individual components of MLflow.
#1) MLflow Tracking
Machine learning model training is heavily driven by iterative experimentation. One may try various experiments by varying hyperparameters, testing new features, getting more data, using different algorithms, and many more.

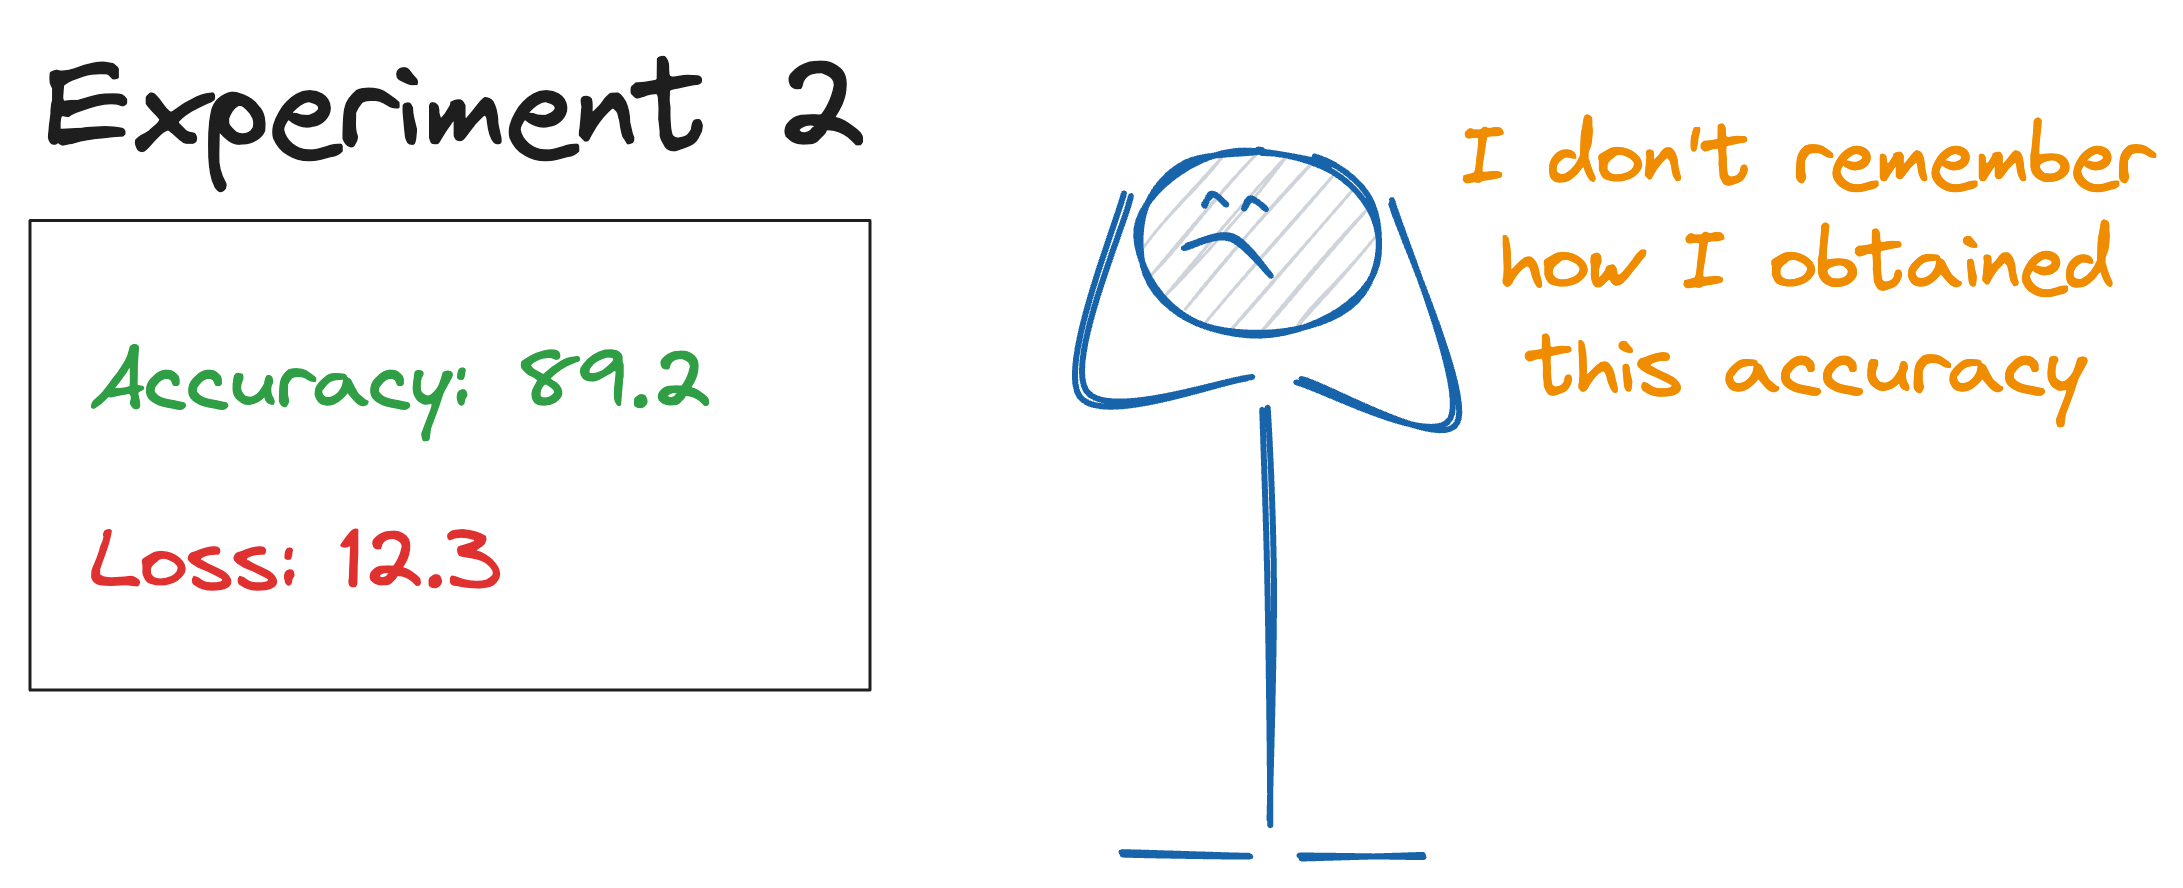
During this iterative experimentation process, one inevitably ends with SO MANY combinations of experimental runs that it is almost impossible to remember how the best models were produced (unless one is manually taking note of everything they did).
In other words, tracing the best model to its exact configuration is quite challenging and tedious.
Why is it important, you may wonder?
Well, the ability to trace the best model to its exact configuration is crucial for several reasons, the primary reason being reproducibility.
Reproducibility is one of the critical aspects of building reliable machine learning. It is fundamental for collaboration among team members and for comparing models across different time points or environments.
Imagine this: Something that one works on one system but does not work on another reflects bad reproducibility practices.
However, definite reproducibility practices ensure that results can be replicated and validated by others, which improves the overall credibility of our work.
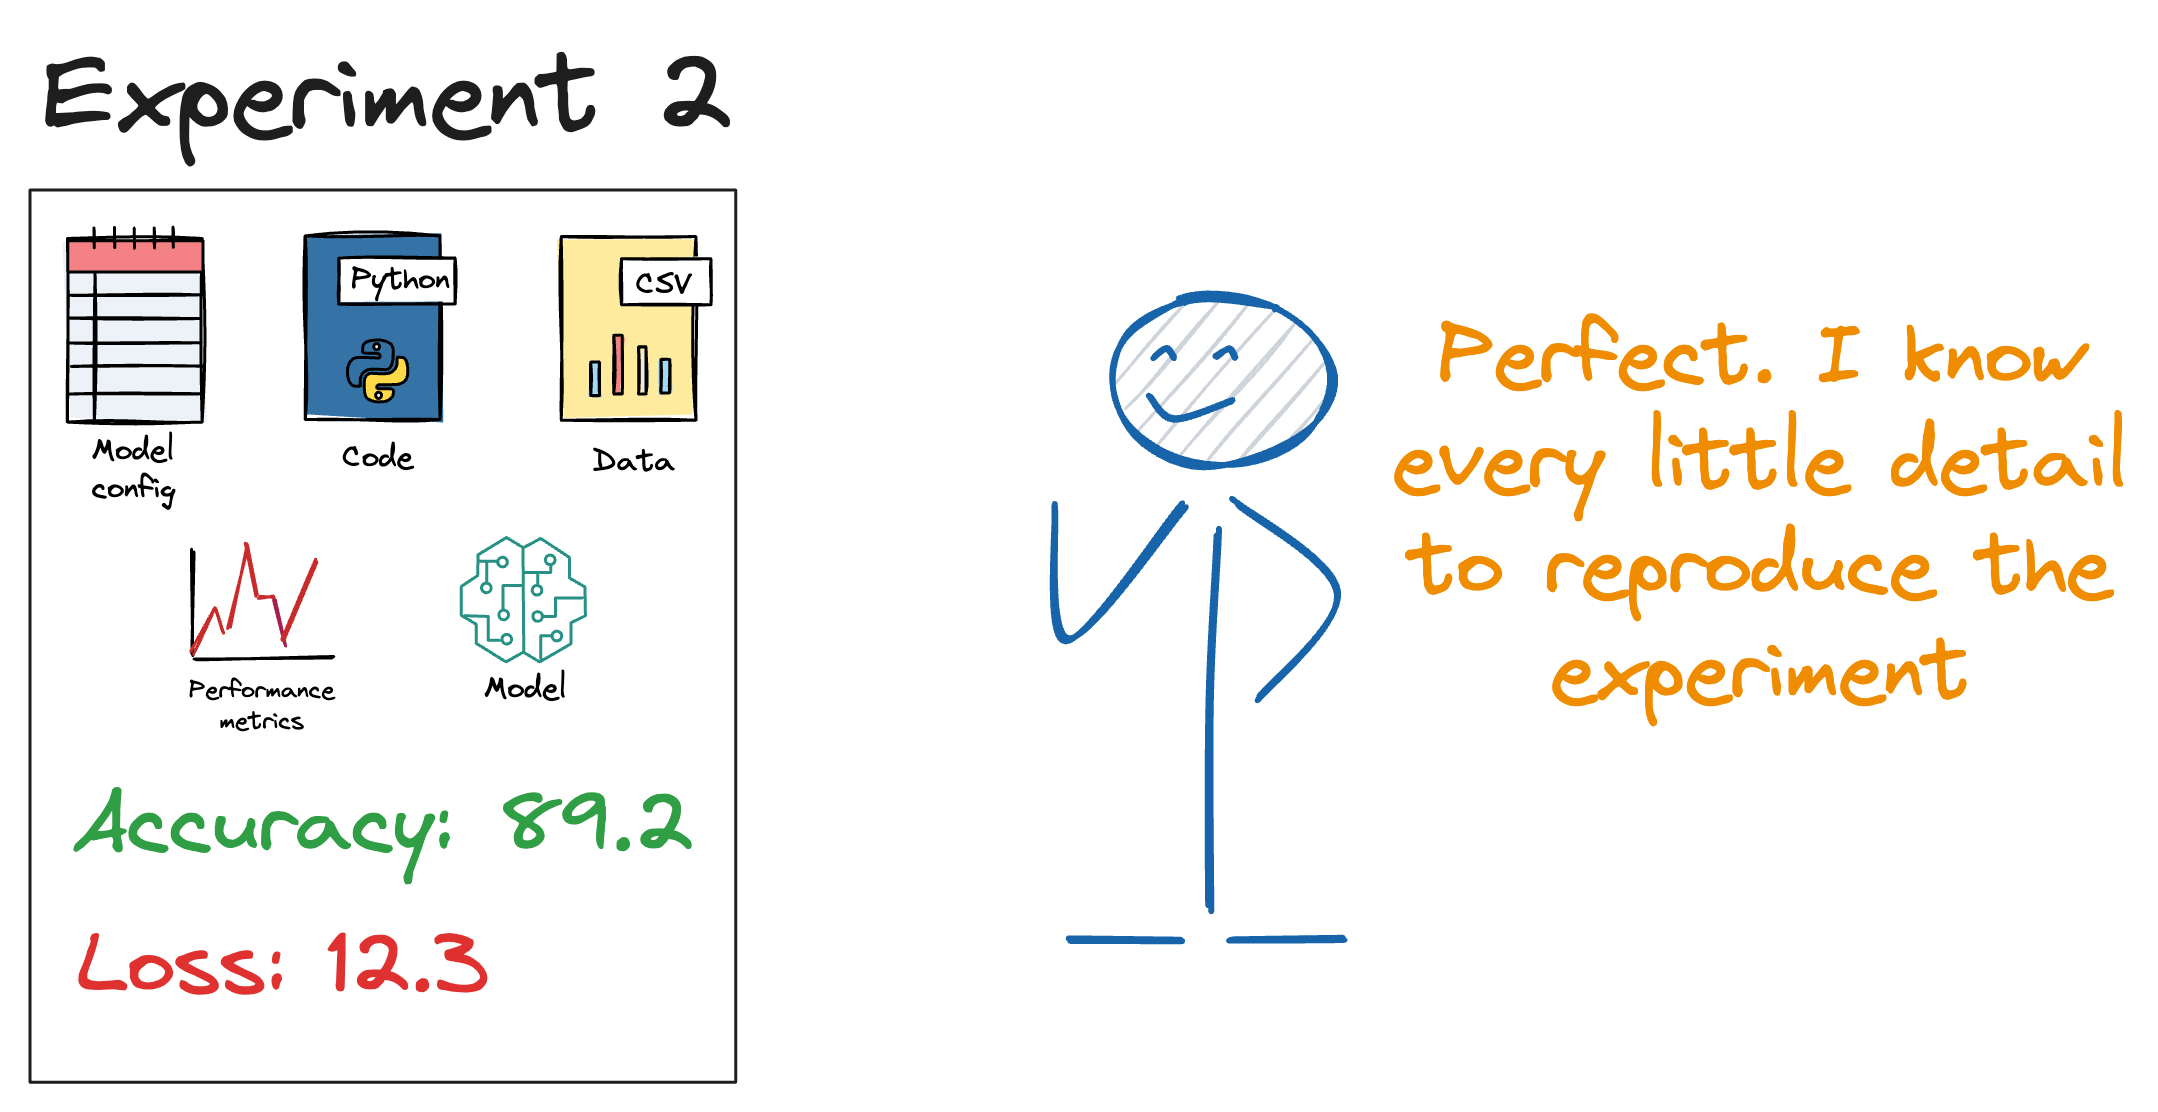
MLflow tracking enables reproducibility by recording and logging all the parameters, code versions, and dependencies used during model training.
This ensures that the entire experimentation process can be reconstructed precisely, allowing others to reproduce the results.
It provides an elegant UI, within which we can view the results of our model logging and compare them.
This UI can either be local or hosted on a remote server, which makes it quite easy to share experiments across different teams.
Experiment and Run terminology
An experiment in MLflow is a named collection of runs, where each run represents a specific execution of a machine learning workflow or training process.
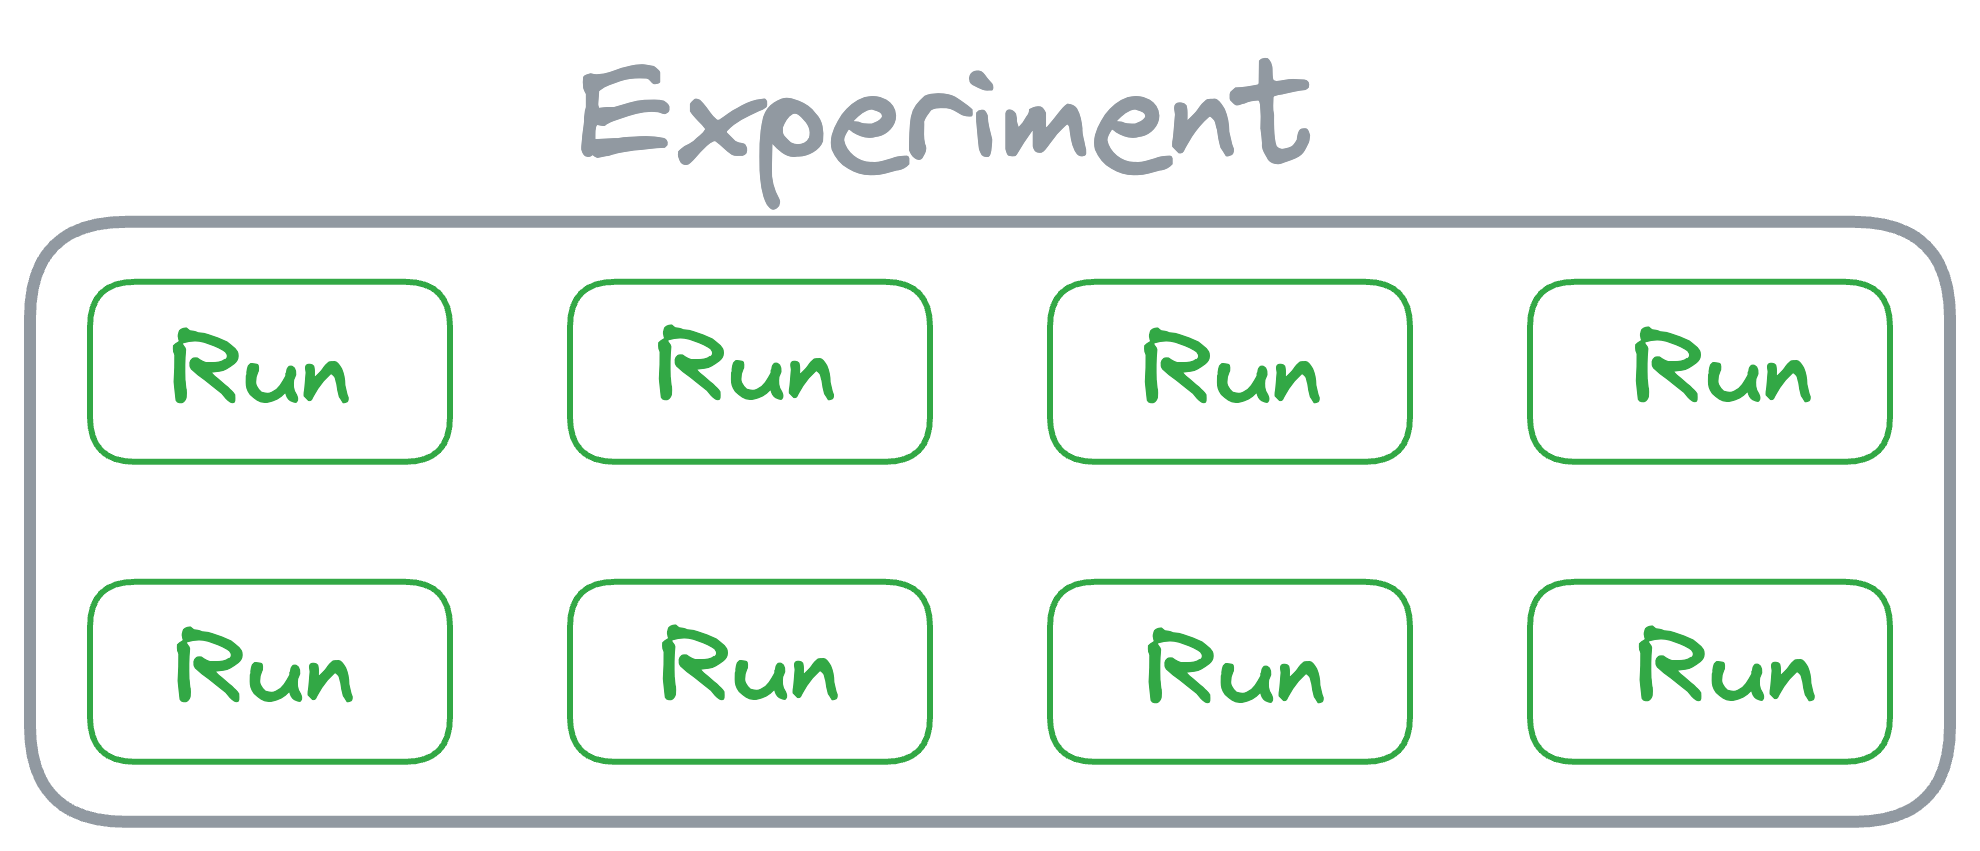
The concept of an experiment is designed to help organize and group together related runs, providing a structured way to manage and compare different iterations of your machine learning models.
When we start a new experiment, MLflow creates a dedicated space for it, allowing us to track and compare runs within that experiment easily.
And to elaborate further, a run is a single execution of a machine learning workflow within a specific experiment.
It encapsulates all the details of that particular execution, including the code, parameters, metrics, and artifacts produced during the run.
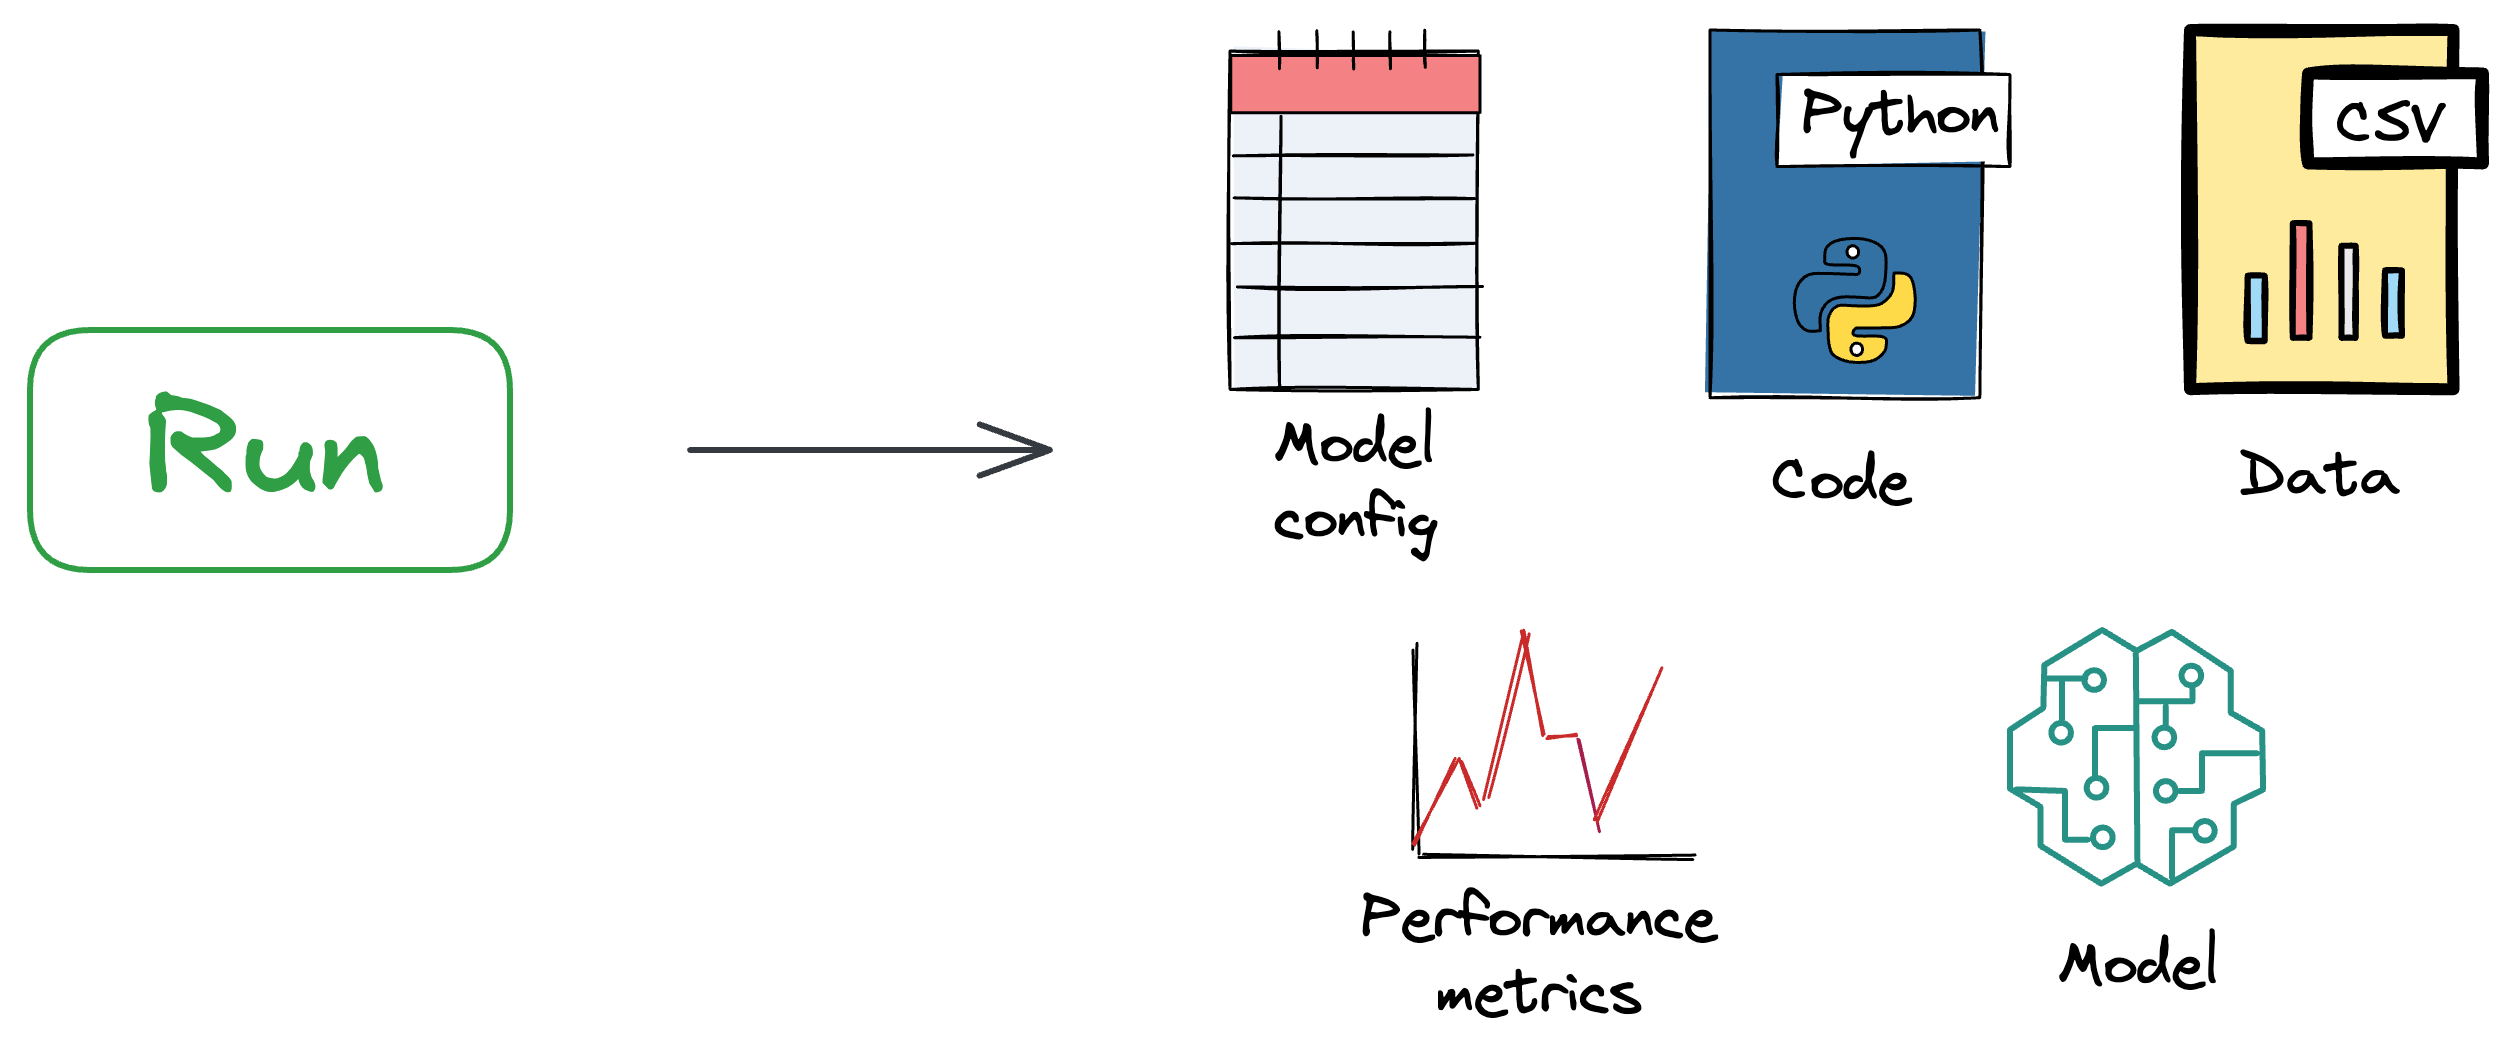
As we will see ahead, MLflow automatically logs various details of a run, such as the hyperparameters used, metrics calculated during training, and any output files or models generated.
The logged information is then accessible through the MLflow Tracking UI or programmatically through the MLflow API.
Sklearn experiment
Before getting into the high-end technical details, let’s do a quick demo of setting up MLflow tracking in a simple data science project and understanding the MLflow UI.
What we shall be demonstrating ahead must be written in scripts and not in a Jupyter notebook.
For this demonstration, consider we have the following dummy classification dataset stored in a CSV:
Let’s assume our training and evaluation script is train_model.py. Let’s train a Random Forest model on this dataset.
First, we begin by specifying the imports:
Next, we specify some hyperparameters/configuration variables for our model:
As it is a classification task, let’s define a performance metric function (performance), which accepts the true labels and prediction labels as parameters and returns three performance metrics:
- F1 score
- Accuracy score
- Precision score
This is implemented below:
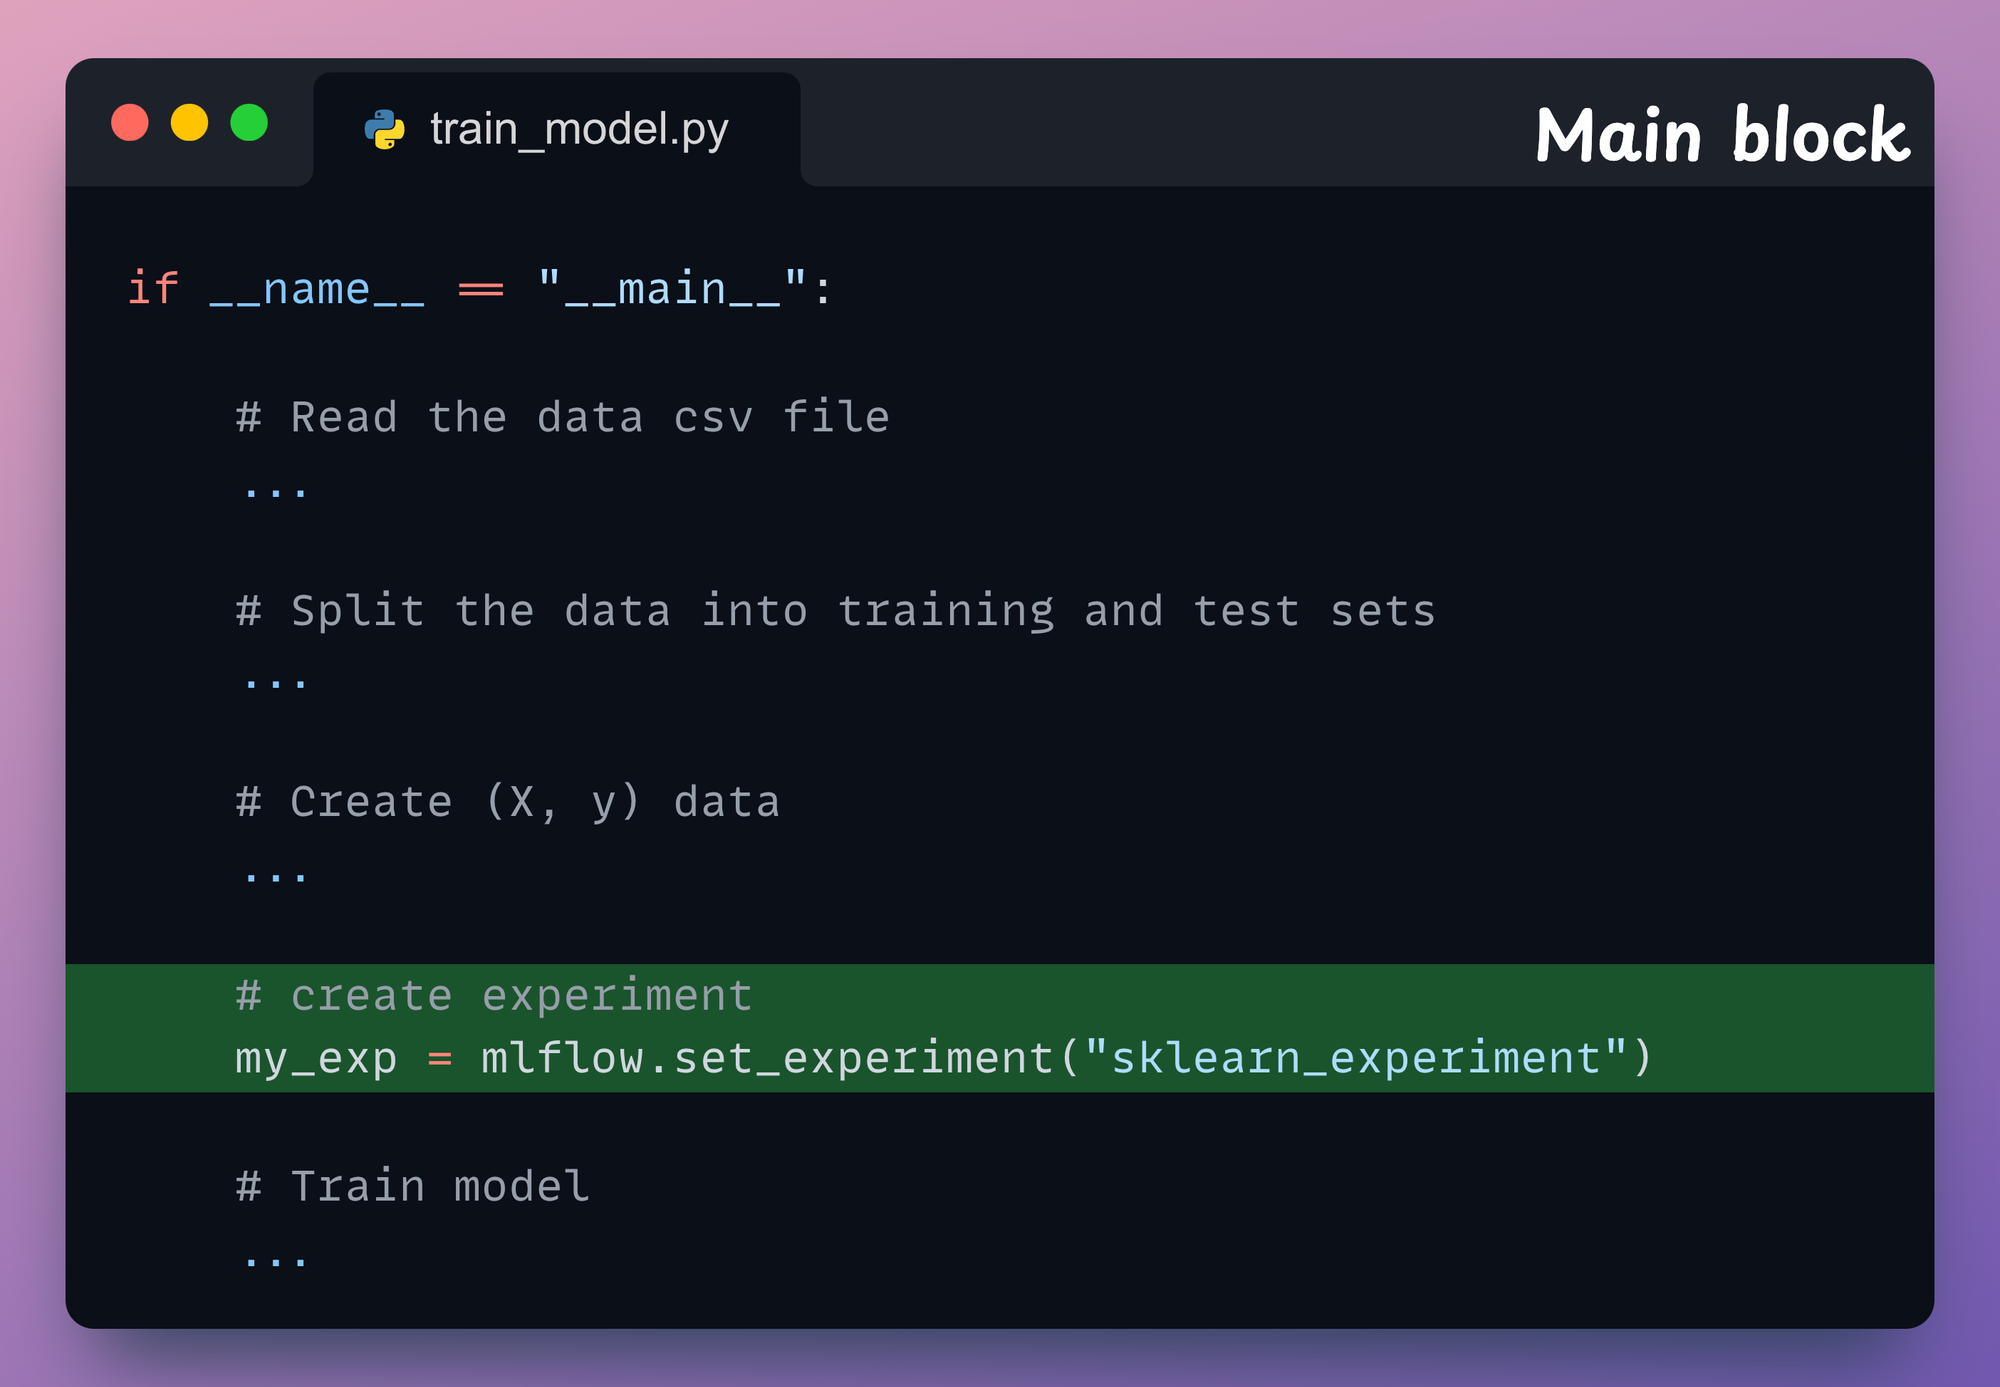
Now, let’s proceed towards implementing the main guard of our model training script — if __name__ == "__main__".
In the above code:
- We start by reading the CSV file.
- Moving on, we split the data into training and test sets based on the specified
test_sizeparameter. - Next, as the
dataDataFrame has all columns (including thelabel), we create it in(X, y)format for training the model. - In this step, we instantiate a
RandomForestClassifiermodel with the specified parameters earlier and train the model. - After training, we generate the predictions on test data using the
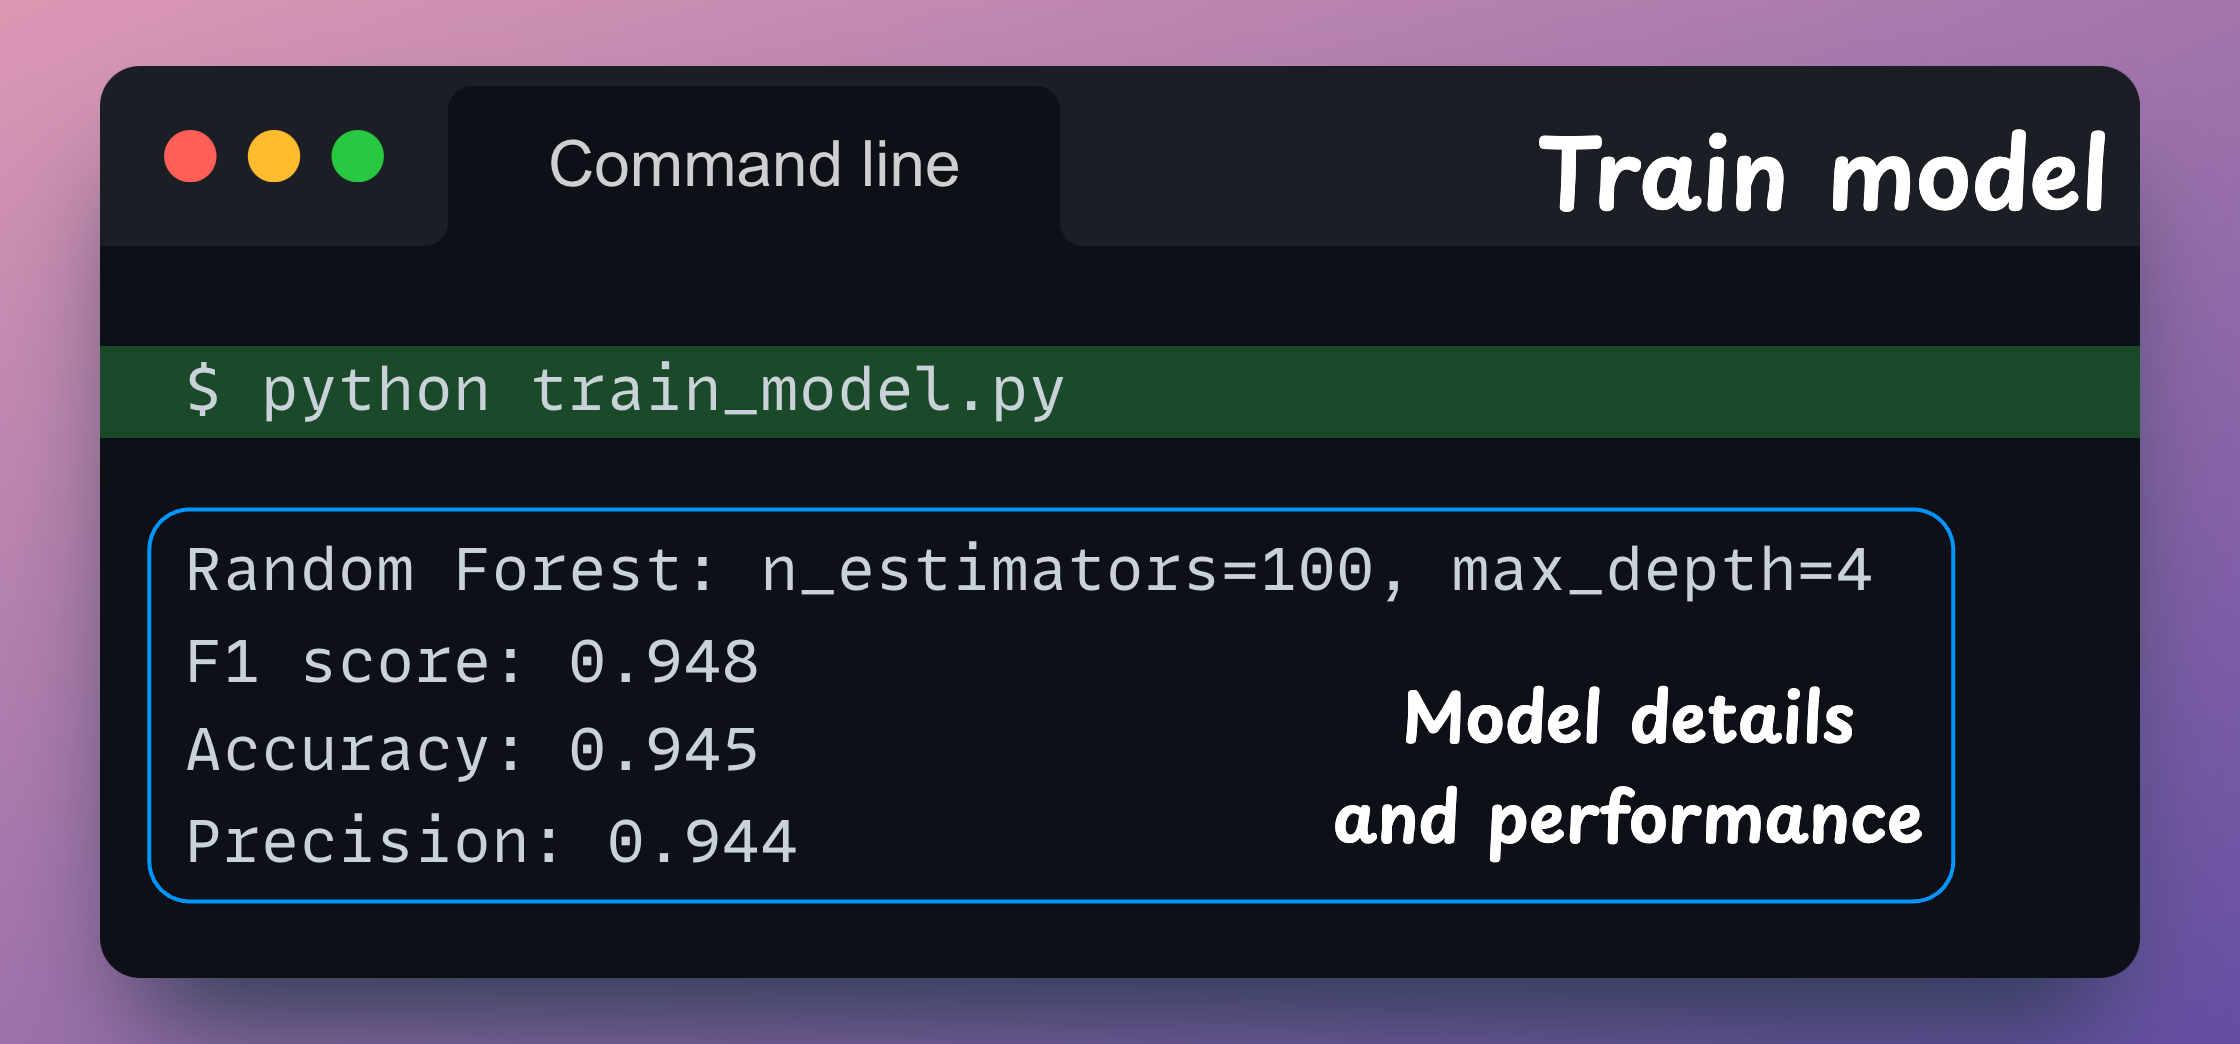
predict()method and evaluate them using theperformance()method we defined earlier. - Finally, we print the model details, such as the
hyperparameters,accuracy,F1andprecision.
Running this script (with python train_model.py) gives the following output:
Moving on, in an attempt to improve the model’s performance, one may try changing the hyperparameters, as demonstrated below:
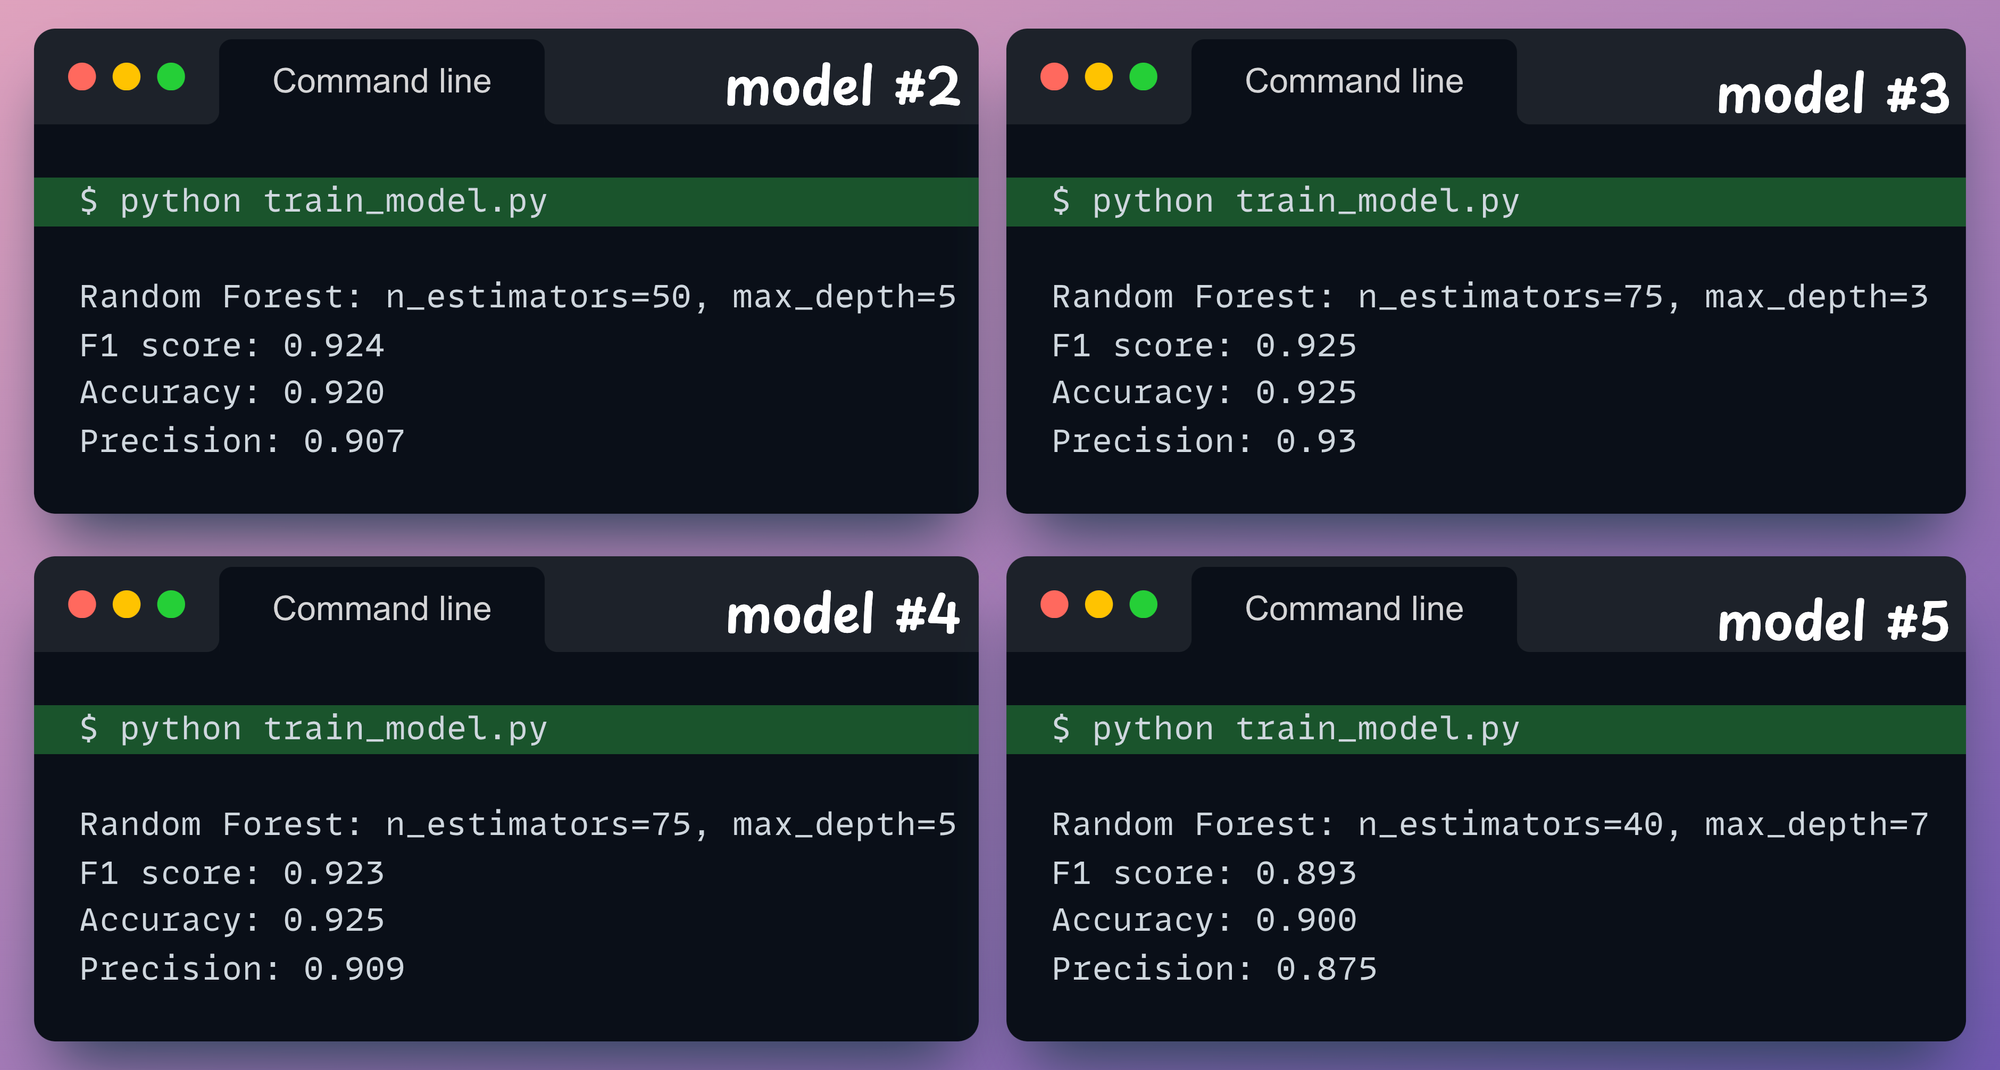
But tracking and comparing all the experiments this way quickly becomes a mess.
Basic MLflow logging demo
Next, let’s see how MLflow tracking can help us simplify model experiment tracking.
Import MLflow
We begin by adding the necessary imports to our train_model.py script:
As we used sklearn in our experiment earlier, we imported the mlflow.sklearn module, which provides an API for logging and loading scikit-learn models.
Create experiment
As discussed earlier, MLflow uses the experiment and run hierarchy to track experiments.
The concept of an experiment is designed to help organize and group together related runs, providing a structured way to manage and compare different iterations of your machine learning models.
We declare an experiment inside the main block using the mlflow.set_experiment() method as follows:
Start model run
Our next objective is to declare a model run, which will be associated with the above experiment.
To do this, we create a context manager (using with keyword) right before instantiating the RandomForestClassifier class.
Next, we indent the model training and performance metric code within that context manager, as demonstrated below:
Indenting the model training code inside the mlflow.start_run() context manager will allow us to record the model training and evaluation metadata.
We aren’t done yet, though.
Log model details
Next, we must also specify the model training and evaluation metadata that we want MLflow to log.
This includes:
- Hyperparameters,
- Performance details,
- Data,
- The type of model trained,
- The trained model, etc.
We must log these details so that we can compare them with other experiment runs.
- To log hyperparameters, we can use the
mlflow.log_params()method. - To log performance metrics, we can use the
mlflow.log_metrics()method. - As we used sklearn, to log this model, we can use the
mlflow.sklearn.log_model()method.
These methods accept a dictionary as an argument, which is a string to parameter/metric mapping, as demonstrated below:
mlflow.log_param() and mlflow.log_metric() methods (the name does not have an ‘s’ at the end). They accept two parameters, the first is a string and the second is the metadata detail. In the log_model() method:
- The first argument is the scikit-learn model to be saved.
- The second argument is the relative artifact path (we shall look at this shortly).
With that, we have implemented a basic model tracking code.
That was easy, wasn’t it?
To recall, we did three things:
- First, we created an experiment using the
mlflow.set_experiment()method. The name specified as a parameter to this method must be kept the same across all runs of the same experiment. - Next, we created a context manager using the
mlflow.start_run()and indented our model training code within that context manager. - Finally, we log model metadata such as hyperparameters, metrics, and the model using the relevant logging methods.
Run MLflow tracking
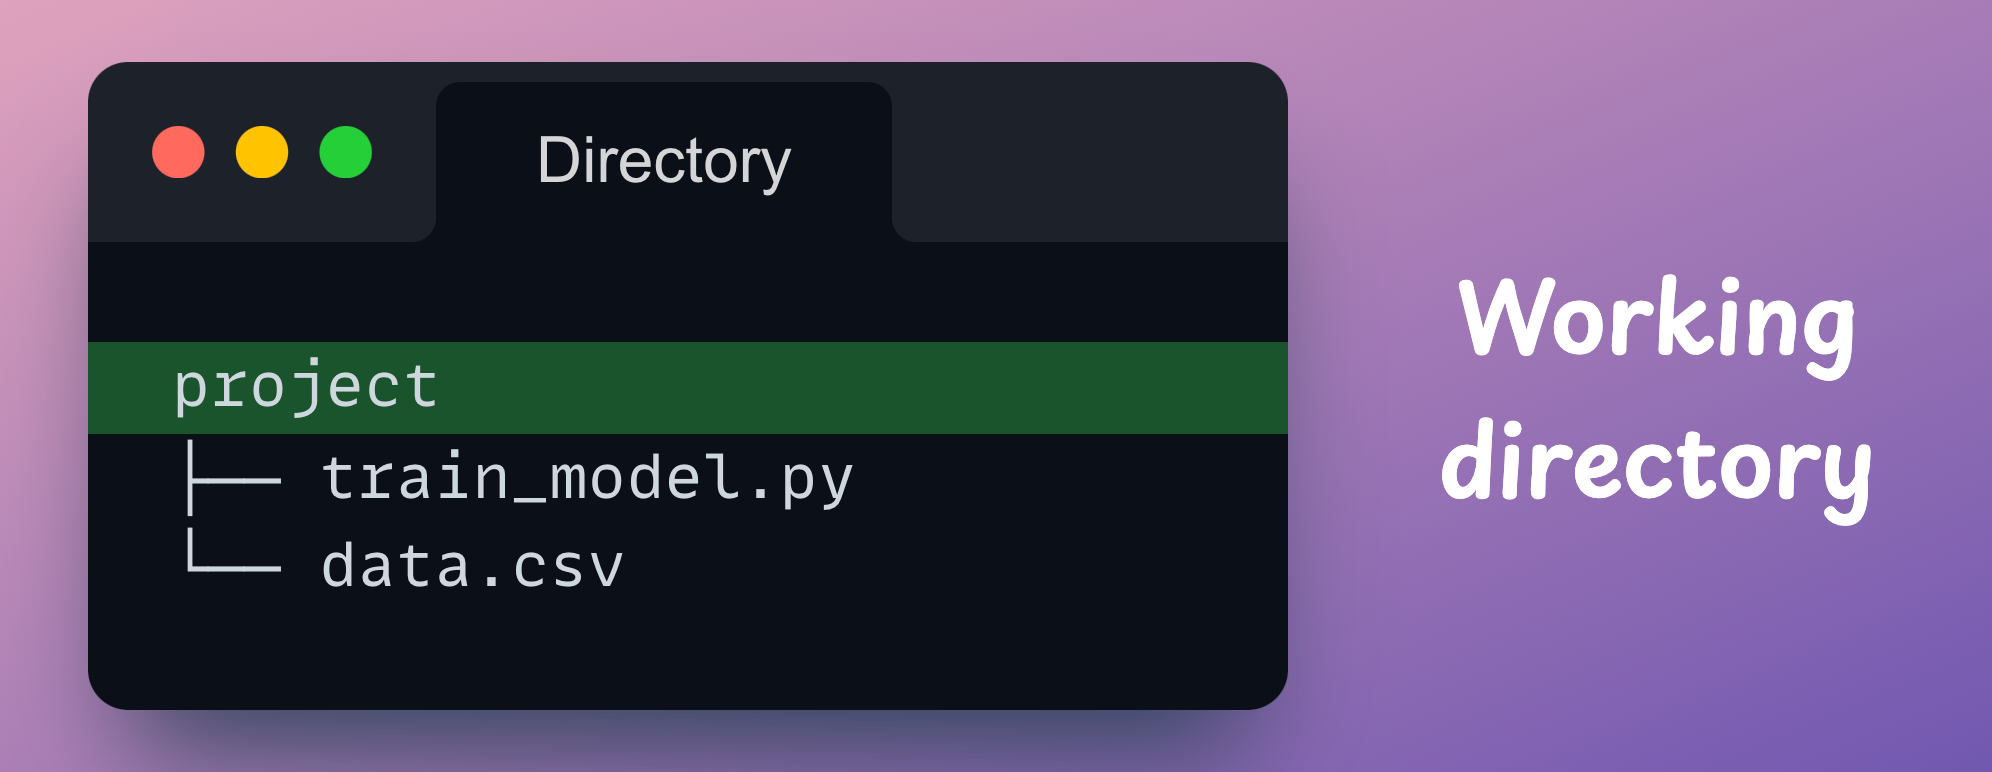
Before we run this script, let’s check the directory structure:
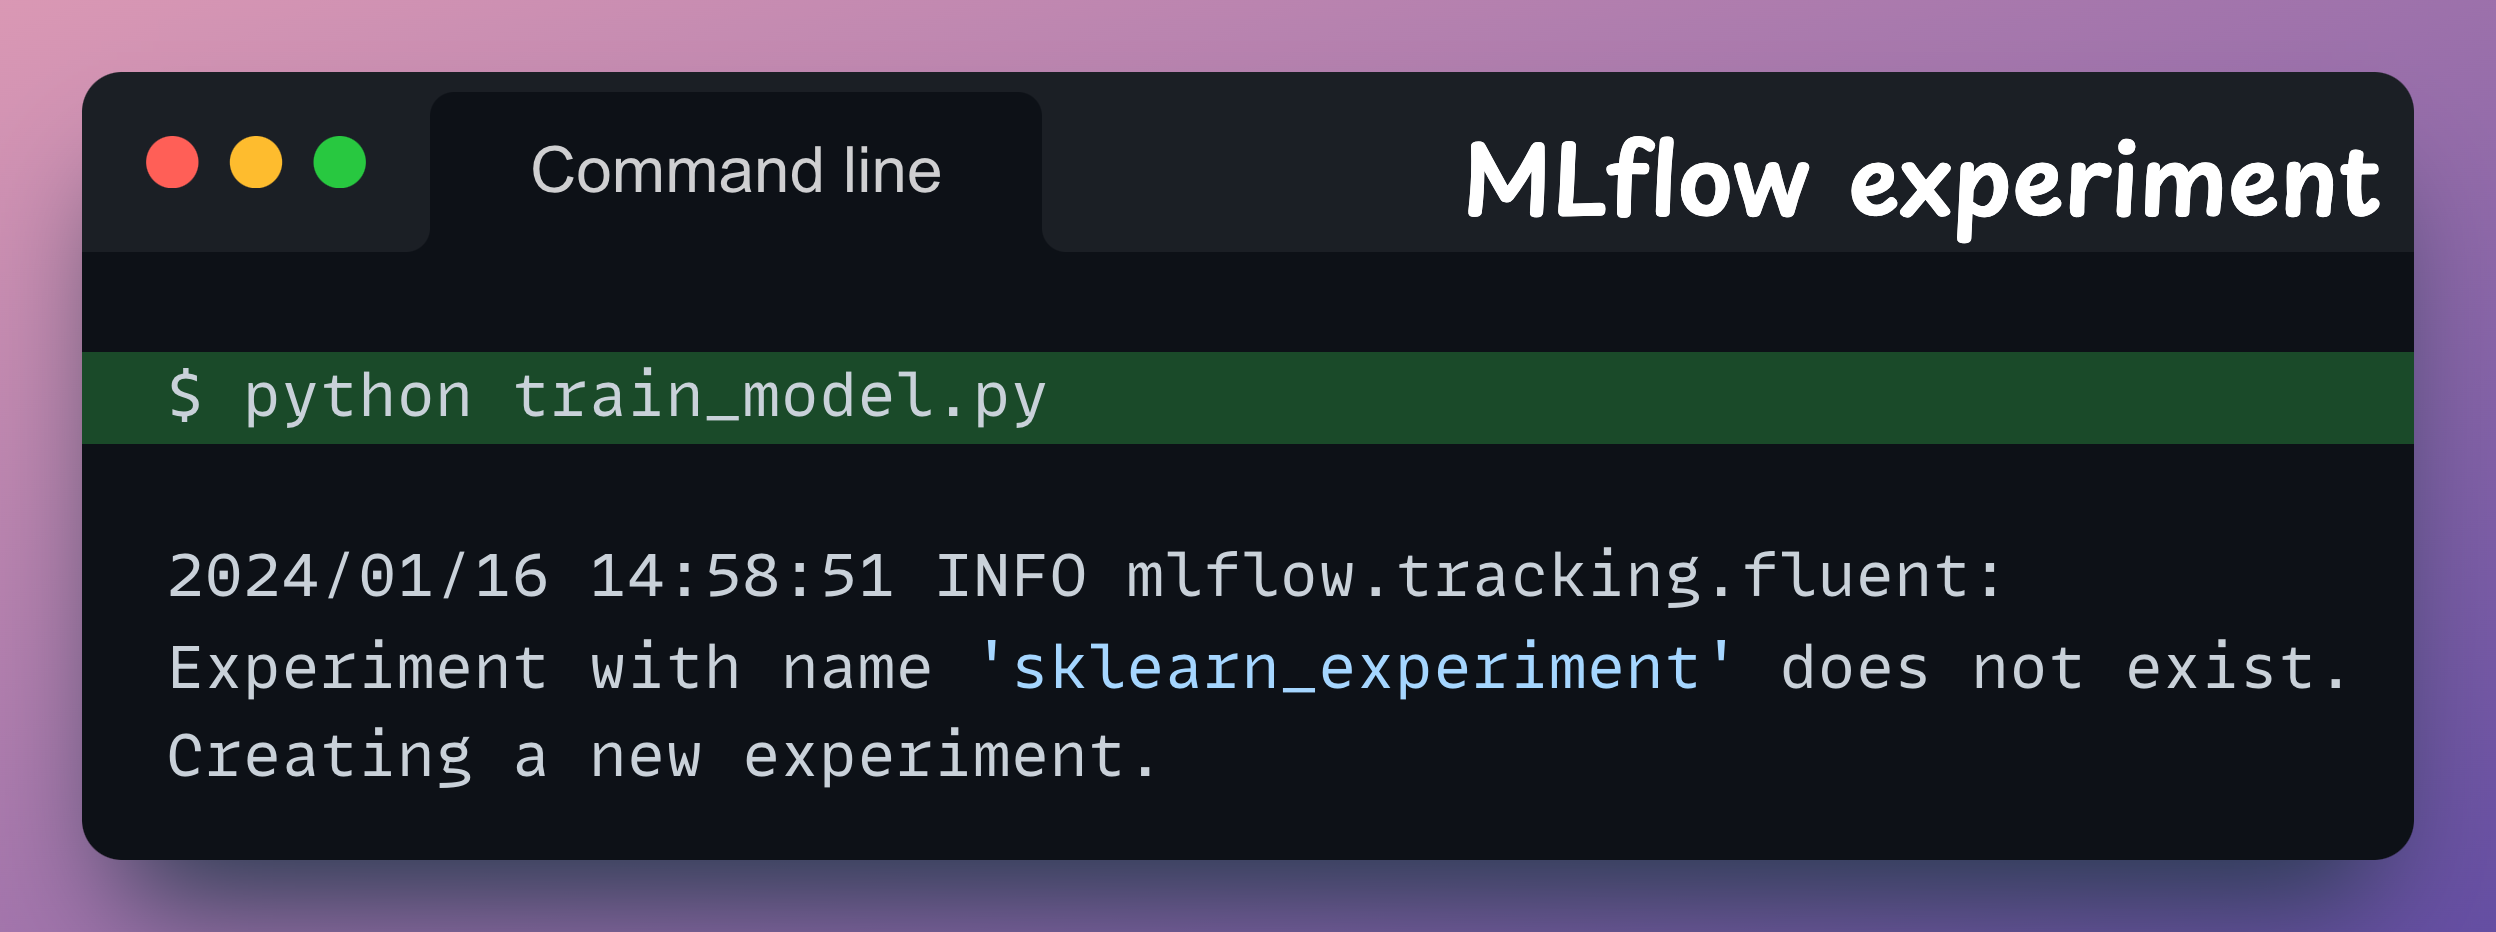
Let’s execute the train_model.py script now:
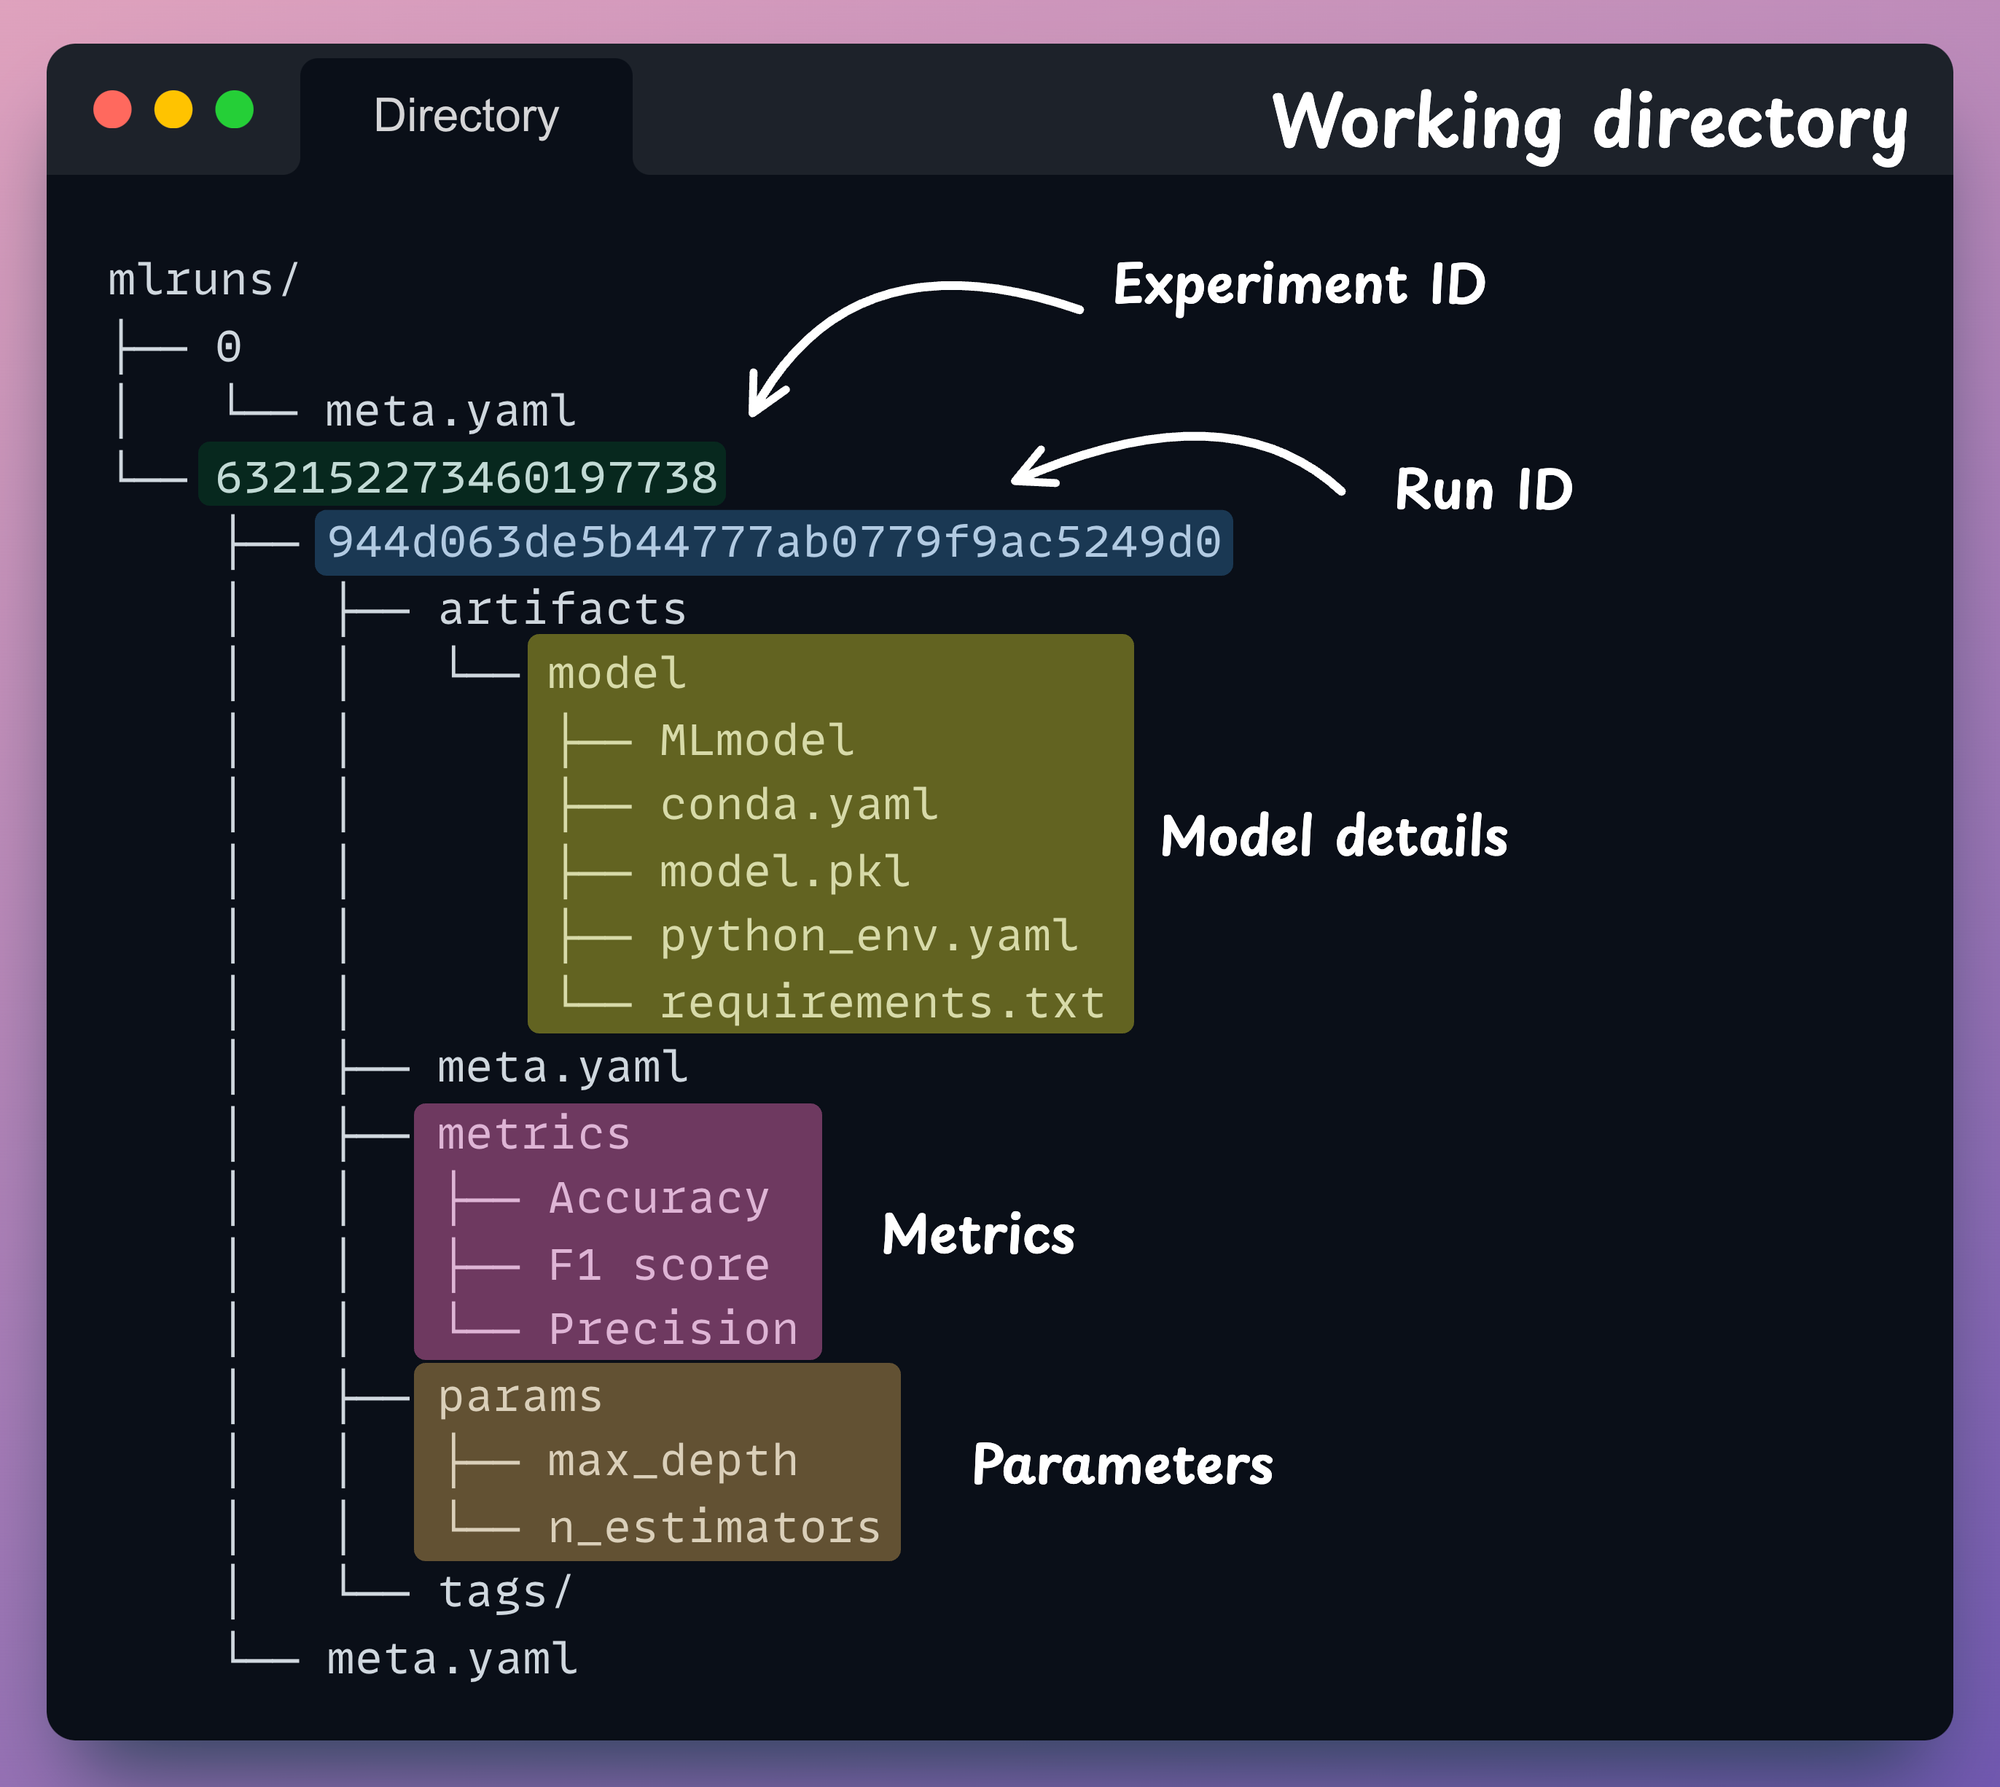
If we check the directory structure now, we notice that MLflow creates a new folder mlruns:
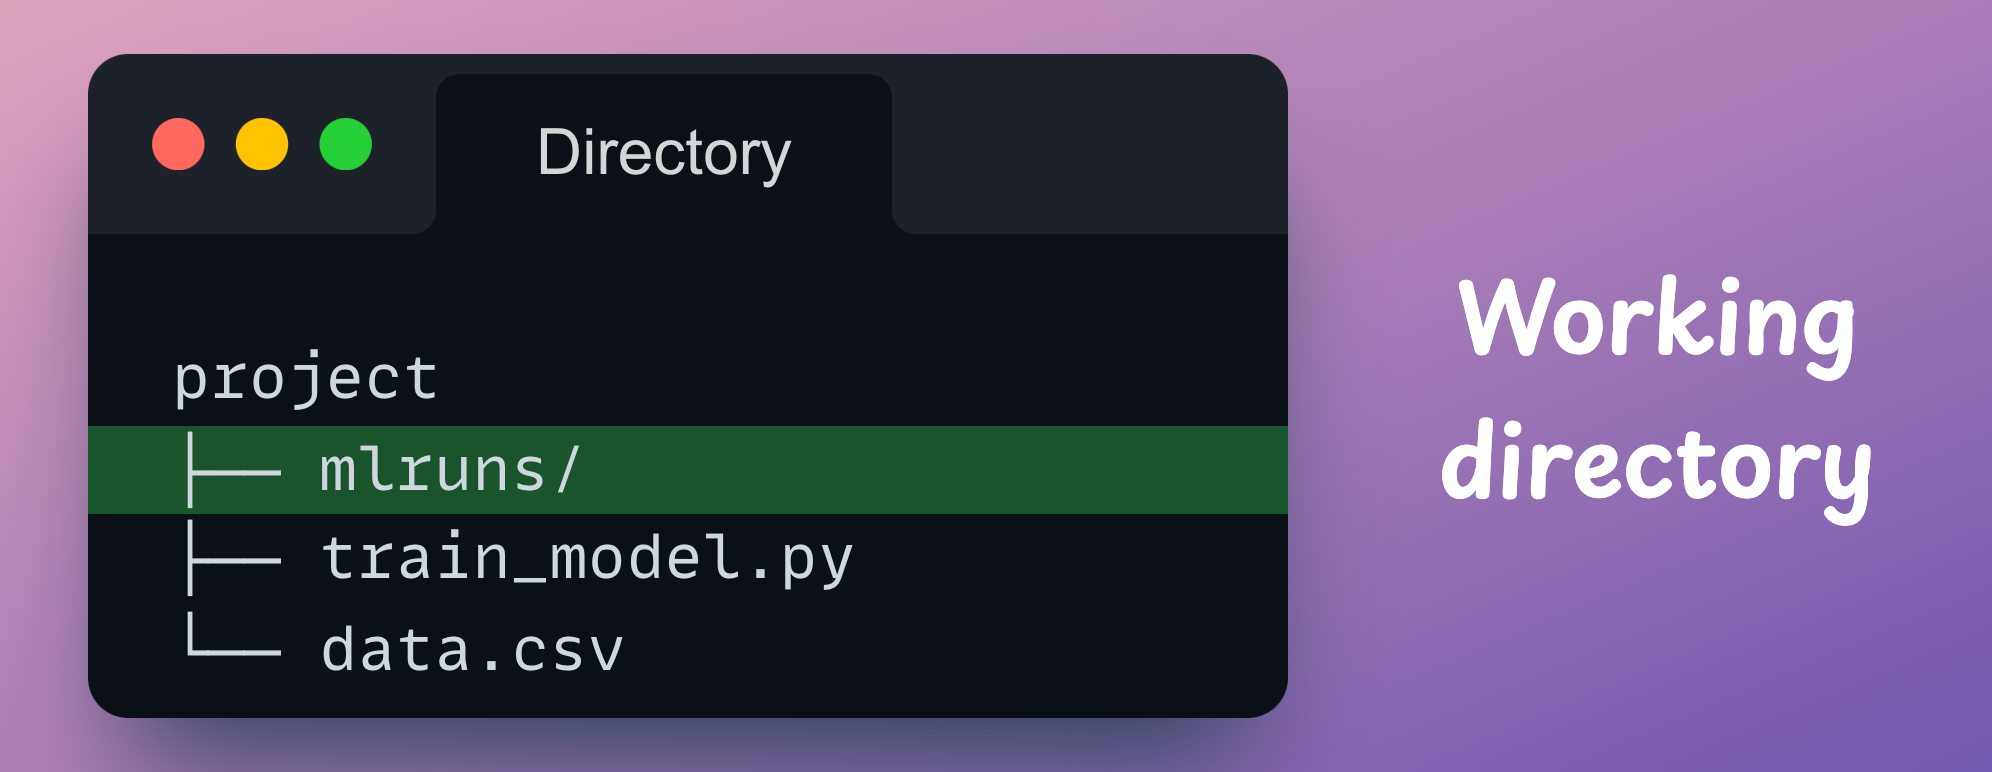
MLflow will store all our logging details in this directory.
mlruns directory has been created locally, if needed, we can also specify the location of a remote server.